Analyzing big data is all about answering questions to deliver value and growth to the organizations. New-age technology such as Advanced Analytics techniques is helping analysts to churn out actionable insights to accelerate decision making.
Technology can take care of the data. Still, to squeeze value from it, IT and the business must collaborate to build an operating model that solves specific business problems, invests wisely by employing the right technology for each phase of the data lifecycle, and delivers cost-effective self-service analytics.
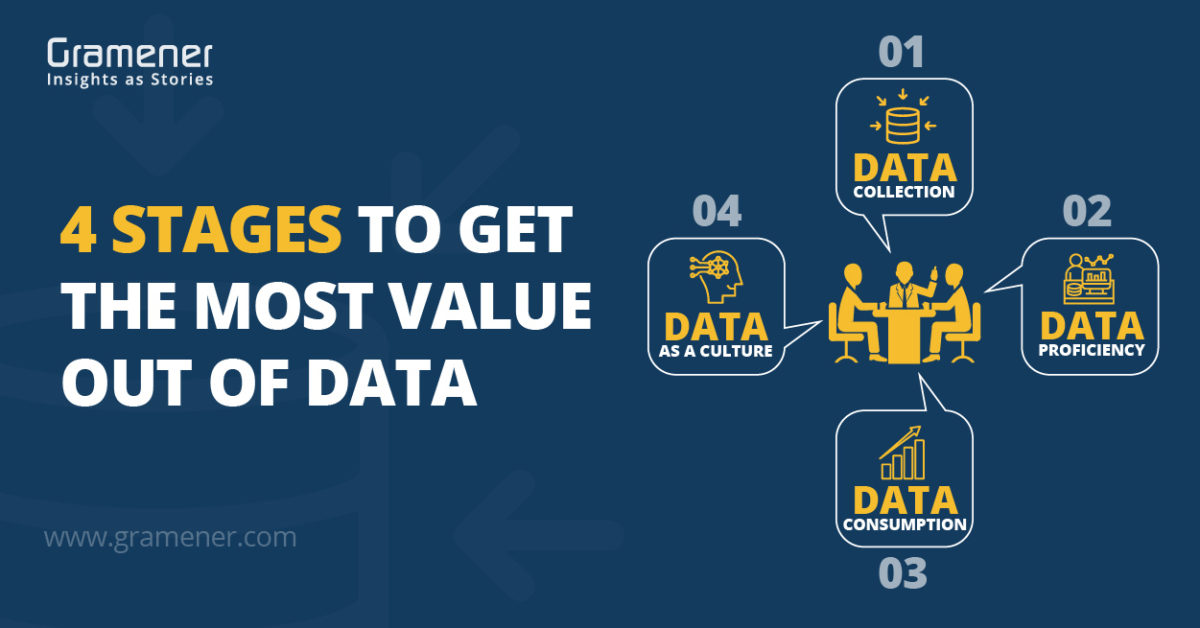
4 stages to Get Most Value from Data
Ways to extract insights from data are subjective to organizations and their sizes. It also depends on the amount of data an organization holds. How a top business consulting firm looks at data analytics will be different from how a start-up looks at it.
This article focuses on the 4 most important stages that include all the operations on data, right from identifying data points to data-driven decisions.
1. Data Collection
Collating the omnipresent data is one of the biggest challenges for organizations. They have multiple data sources such as transactions, social media, logs, BI reporting tools, and more. There are possibilities that business users might miss critical information from valuable sources. Collating all the data in one place is the first step of data awareness, which helps organizations define questions.
Each data source can give rise to multiple questions. For example, transaction logs data can offer answers such as total sales over a while, bottlenecks in the sales funnel and stand by payments.
Data collection can either be done manually, in case the data is not huge, or through automated techniques.
The next step is data transformation, where the action from the Data Engineering model kicks in. Data Engineering is the aspect of data science that focuses on practical applications of data collection and analysis. The models help with cleaning and massaging the data by removing unwanted information from it.
2. Data Proficiency
Data proficiency is the next stage to get maximum value out of data. It puts to tests the abilities of data scientists to report the insights from both structured and unstructured data. It is the study of data that involves developing methods of recording, storing, and analyzing data to extract useful information effectively.
Multiple analytics techniques, such as descriptive, predictive, and diagnostic, are used to churn actionable insights from cleansed data.
For example, reporting works on descriptive analysis where we look at the performance and KPIs from the past and pick simple insights. Excel sheets and tabular reports can be the best way to present information.
To go way more profound and ask essential questions, you must take help from diagnostic analytics. It not only tells what happened but also highlights why it happened.
For example, with the descriptive analysis, you can find out why the overall sales performance was low. But, with diagnostic analysis, you can dig deeper and find out the reasons for such a setback. The reasons could be a downfall in sales in a particular region, reduction in sales representatives, and more.
3. Data or Insight Consumption
Data analysis will not add value to the users if it does not make the insights easily consumable. Business users are busy and have less time to understand the outcome of the analysis.
The question arises, “How to offer insights rapidly?”
There are methods for easy data consumption which make insights interesting. Techniques such as data visualizations, narratives, and data stories help a lot to convey insights in simple formats.
Data visualization is the pictorial representation of data with graphs, charts, infographics, and more. In the world of Big Data, data visualization tools and technologies are essential to analyze massive amounts of information and make data-driven decisions.
Data Narrative is a summary of the insights found during data analysis. Data narratives can be short paragraphs in simple language or can be powerpoint presentations with a few bullet points. The idea is to convey only valuable insights and aid in decision making.
Data stories are the new-age data consumption method and version 2.0 of data narratives. Data stories are narrated in multiple formats such as infographics, Data story GIFS, Comic Data Stories, and Video data stories. Stories are memorable and presenting insights as stories offer better chances of converting insights into decisions.
4. Data as a culture
Becoming a data-driven organization and implementing data as a culture is the final stage to make data-driven decisions and using them to get maximum value.
A data-driven culture is a workplace environment that employs a consistent, repeatable approach to tactical and strategic decision-making through positive and empirical data proof. In short, it’s an organization that bases decisions on data, not gut instinct.
IT and business processes work in synergy to complete the circle. IT offers various integrations of data sources and apps to the analytics platform, while business users work on decisions to implement the data infrastructure into their processes.
Organizations on the path of being data-driven must invest in people, processes, and technology. Building a successful data science team requires gathering a group of UI/UX developers for different functional roles, building a team of data scientists, analysts, and creative storytellers.
Successful data science can help the organization climb the data maturity ladder with a focused approach by creating responses and actions through prescriptive analytics, and building machine learning, forecast modeling, and sentiment analysis capabilities.
Where Do You Rank in Data Maturity?
All the efforts to make sense out of data go to waste if it does not benefit anyone. Finally, it all comes down to decisions. The real holy grail of data science is when every decision made is rooted in data. That’s called data-driven decision-making.
But, what can you do to transform your organization into a data-driven organization? The answer lies in how mature your organization is in terms of data. Understanding the level of data science maturity can open ways to collect, analyze, and consume data that aligns with impactful decisions.
These decisions introduce data as a culture in organizations where everyone, right from the top management to the subordinates, is creating workflows and taking actions based on the insights. It ultimately takes the organization in a scalable position where everything is measurable and predictable.
Implementing data as a culture in the organization involves enabling end-users with the ability to perform their analysis, without the need for IT, on a trusted and supported architecture. A data maturity model allows the business to increase the speed and number of iterations in its analytics development and also provides the required compliance, security, and scalability of enterprise IT infrastructure.
About Gramener
Enterprises have access to information, but the gap between data science and business impact is too wide. Gramener is a data science consulting company that partners with enterprises to bridge this gap and enable decision-making by extracting Insights and Communicating them as memorable stories.
At Gramener, we dedicatedly work with top executives and help them transform into a data-driven organization. The aim of our data science consulting, which includes executive education, and a variety of data advisory workshops is to lay a successful data science roadmap by assessing the level of data maturity of the organization. Take a free assessment and find out where does your organization stand in the levels of data maturity.
We are leveraging People, Process & Technology to accelerate and automate Insight generation & consumption with greater emphasis on Pharma, Media & Entertainment, Banking & Financial Services, and Non-Profit sectors.
If you like the article, let us know your thoughts in the comments below. Share it on social media and follow Gramener for more data stories.