

We are back again with yet another episode of our Data Storytelling Hackathon. Check out some wonderful video data stories for you to easily consume the insights in not more than 2 minutes.
Earlier, during our previous hackathons, we created fantastic, Digital Data Visualizations, visual data stories, and physical data visualizations. However, there are many data storytelling formats, that are yet unexplored. Picking one, we decided to dedicate this hackathon to creating video data stories.

But, we did not keep it mandatory and the participants were also allowed to create stories in any format.
What are video data stories?
Movies keep you hooked through its story, surprises, and characters. Video data stories do the same. Creating video data stories is enriching visual storytelling experience with clear audio and graphic motion. The audience craves more for insights, with every second passing. Furthermore, It bridges the gap between exploratory and explanatory data stories.
Renown Spanish information designer and professor, Alberto Cairo, mentioned in one of his blogs:
What Should We Emphasize When Designing A Visualization? Should We Explain The Data, Perhaps Through A Narration, Or Should We Let Readers Explore The Data At-Will?…
…The Answer Is Quite Obvious: If Your Graphic Is A Digital And Interactive One, Why Shouldn’t You Combine Narration With Exploration?
Alberto Cairo
Adding a play button to the Data Visualizations adds narration to data exploration. A video data story comes with a predefined narrative that makes the audience lean back and relax, rather than lean in and explore insights.
Video Data Stories produced at Data Storytelling Hackathon
The objective of the hackathon was to create 2-minute data movies with clear narration. The participation from within and outside Gramener opened many ideas on the table. Here are some hand-picked video data stories for you.
I. Hear Us Roar
If someone asks you about Tiger endangerment, show them this video data story. Hari, Arihant, and Vyankatesh brought out the truth on the rise of Indian Tigers.
The population of tigers had not just increased but doubled from 1200 to 3500 during the 1970s – 1990s. However, there was a massive downfall in the population of tigers after the 90s. But… Well, no spoilers here.

II. Fastest Fingers First
How quick are you in solving a Rubik’s Cube? It took me 7 minutes to solve just one facet of the cube. Surprisingly, in November 2018, during a competition, Yusheng Du solved the whole Rubik’s cube in a record-breaking time of 3.47 seconds.
Amazing, right? Ganes, Anand, and Nikhil compiled some of the whacky records and stories on speedcubing. Check them out.

III. Summer is Coming
Who said that only winters could send chills down your spine. A tiny thought of global warming and climate change is enough to do the same. Greenland, a beautiful European island, has enough ice to raise the sea level by 23 feet.
In fact, 12 billion ton of ice has already melted by August 1st, 2019. Ranjan, Steni, and Soumya have put together this horrific-yet-eyeopener data story.

IV. 22 Years in 22 Yards
Cheers to the love of cricket. Adding to the famous Bar chart race, here’s a small story about the ODI rankings of batsmen. Who went up to the ranks and who came down from 1998 to 2019, this story summarizes all.
The story from Sandipan, Akash, and Mownika is guaranteed to keep you hooked till the end. And it’s super easy to create bar chart races. A tip – Here’s a small tutorial for you to easily create a bar chart race in powerpoint.

V. Read Good with Goodreads
Books, books, and more books. So many books to read and so little time. How cool it would be if we could decide what to read in a jiffy.
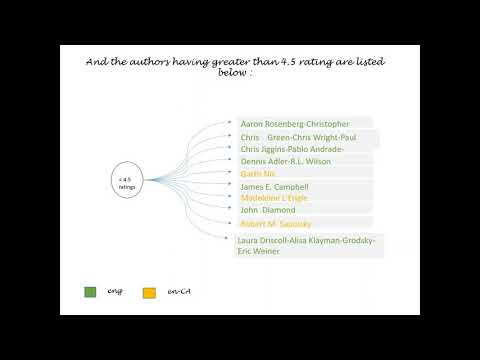
Gramener’s Prashant, Saman, and Athiban created a fantastic data story to help you find your next good read. They evaluated 13,705 books on Goodreads and ranked them based on popular languages and authors with a rating of 4.5 and above.
VI. General Elections 2019 – A Chamber of Secrets
The Modi wave swept everyone across the country and painted the map orange during the General elections 2019. But, amidst the landslide victory, there are some hidden secrets. For example, out of one Billion population, that’s above the age of 18, only 900 Million registered to vote.
A significant number, eh? Gramener’s Vamsi, Mamta, and Anwesh analyzed and compiled the astonishing secrets from Election 2019. Bonus – if you want to see interesting insights from the elections, check out our blog on A to Z insights from 2019 general elections.

VII. Bitcoins – Gold Nuggets
Bitcoins are the buzzing currency and a hot debatable topic. What if the value of bitcoins surpass every currency in the world? Who do you think would be the richest man in the world? Giri and Sushmitha reveal the history of bitcoins in the second episode of ‘Last Week with Data.’

You can join us
We conduct hackathons on the 2nd Friday of every month. You can join us either in person from Hyderabad/Bangalore, or through remote participation. Register for the hackathon through Meetup.
So, how did you like the video data stories? Comment down and let us know your favorite. Follow us on social media, where we post exciting data stories and visualizations. Also, check out our official Gramener hackathon page for all the news on existing and upcoming hackathons. Till then, keep storifying your data.