

This is part 3 of a 4-part series on The Making of Manhattan’s Coffee.
Read Part 1 and Part 2.
Excel has a powerful 3D Map feature. I discovered it quite by accident when Navya shared a really interesting screenshot of what could be done with it.
I started with two inputs. First, an Excel file that had each coffee shop’s address, latitude, longitude and population coverage. Second, a shapefile with the coverage area of the Manhattan coffee shops.
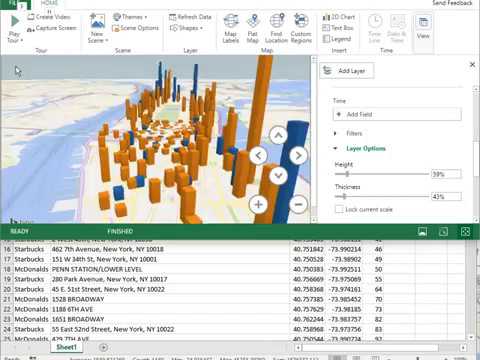
Render points on a map
By setting the “lat” column as Latitude, “lng” column as Longitude, “Pop” column as height and “store” column as the category, we instantly get a map that can be rotated in 3D.
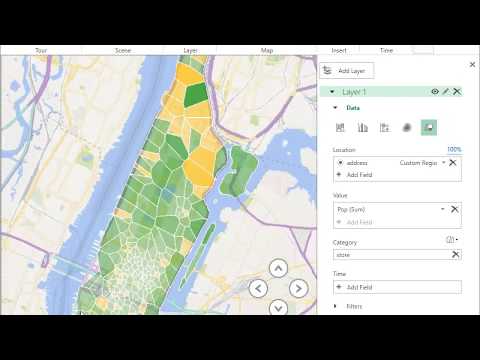
Create a choropleth
You can also import a Shapefile to create a Choropleth.
- Select Custom Regions > Import New Set and add your Shapefile. When importing, select “Pick Region Name From:” as a field that you want to map to your data. In my case, it was “address” — a unique key. (Actually, it isn’t unique. There’s a Starbucks and McDonald’s at 655 W 34th St. But I missed that.)
- Select Add Layer. Under Location, choose “address” as a Custom Region (.kml, .shp). This maps the address column in the Excel file to the “address” field in the Shapefile

- Select the Map type as “Region”
- Select Value as “Pop (Sum)”. This sets the intensity of each region based on the population.
- Select Category as “store”. This colors the region based on the store.
This gives us a choropleth in Excel.
You can combine both of these into a single map by adding them as separate layers using the “Add Layer” button.
Create a tour
Excel 3D Map supports “Tours” — views of data that can be converted into a video. A Tour has multiple scenes. Each scene can show its own data. 3D Map transitions from one scene to another smoothly. You can decide the duration of the transition.
To create a new scene, select New scene > Copy of … and make a copy of your scene. Then modify it as you need. When you click on “Play tour”, 3D Map will smoothly move from one scene to another.
To change the delay, select “Scene Options” and change the Scene duration (how long the scene stays on the screen) or Transition duration (how long it takes to move from the previous scene to this scene.)

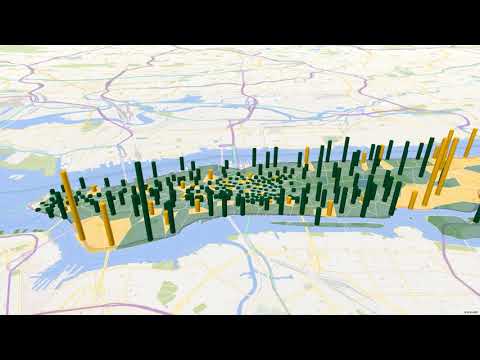
Putting it together
I applied these to create a single Excel file that has a 90-second tour. This was the file used in the Manhattan Coffee Kings video.
Pingback: Physical & digital 3D maps | Blog