
Hi, I am Padma Lahari. I’ve been with Gramener for four months now. I work as a Trainee Data Science Engineer. I was pretty excited to Join Gramener. Although, I wasn’t sure how it was going to be. But, it turned out really well as I started knowing everyone, deliberately.
Gramener has a friendly work environment. I am keen to learn new things. I joined as a developer and learned about the prerequisites before starting a project. After a couple of months, I got to work on an internal project. Later, I moved to another project, working for a leading not-for-profit organization. I am currently a part of it.
To support learning, teams at Gramener organize activities like ‘Data Storytelling hackathon’ on the second Friday of every month. The agenda of this event is to learn new methods of data storytelling and create visualizations in different formats.
This intrigued me. I wanted to give it a try. I partnered with Deekshita, one of my colleagues. We took a simple data set on a very critical topic, ‘Suicides in India’. We went through the data, analyzed it and noted the insights which we found. Next, we had to show insights in the form of physical data visualization. It’s an interesting concept of creating handmade data visualizations using elements like clay, colored papers, threads, etc.
We got an idea of making the human figures using clay dough. We represented the age of people by the size of the figures. For example, we made small clay figures to show the age group of 0 – 14 and increased the size of figures respectively. We used the length of woolen threads to show the highest and lowest number of suicides among various age groups. Below is the final output we got.
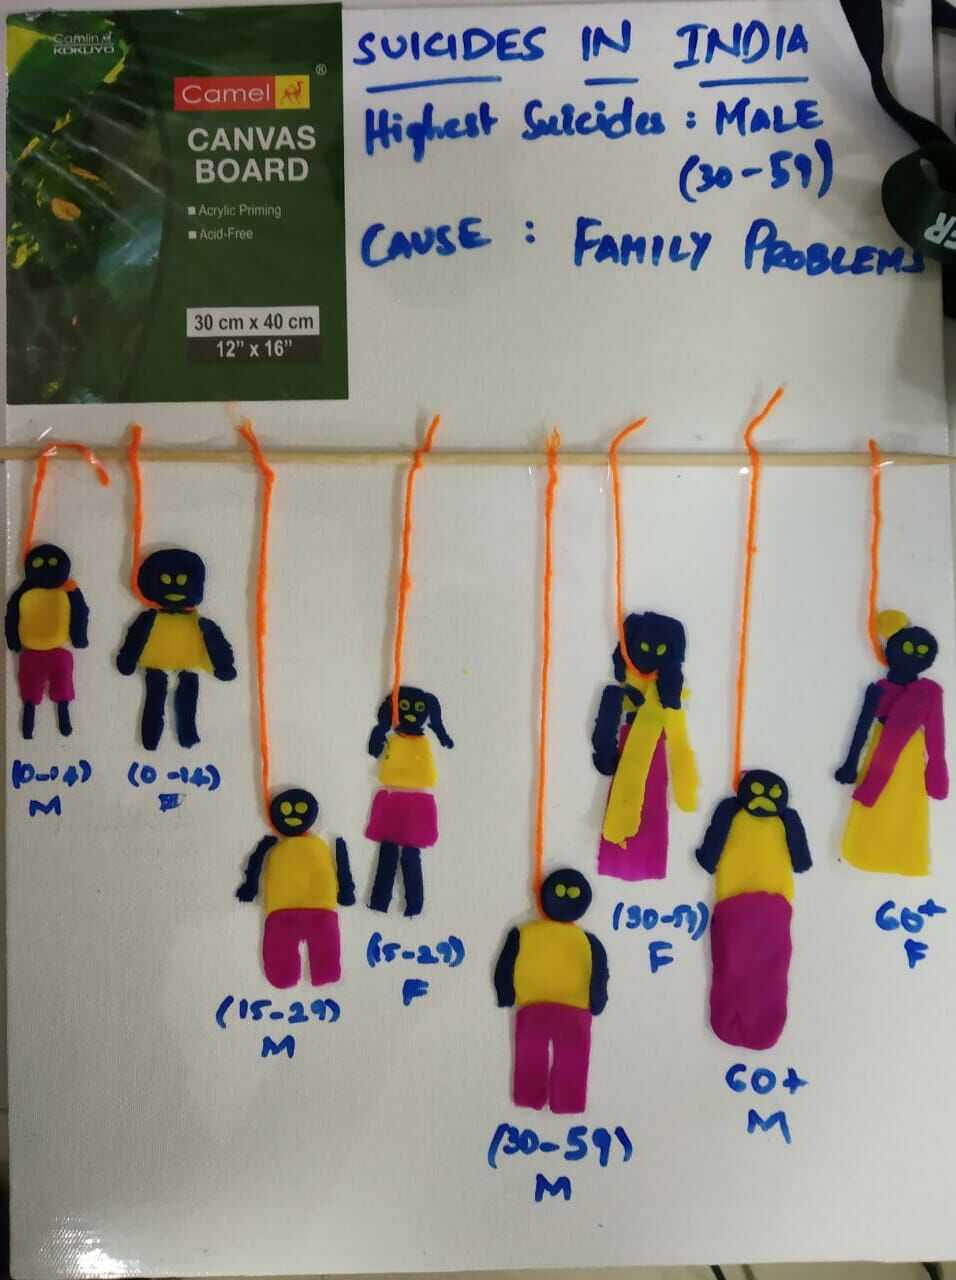
Surprisingly, the highest number of suicides in India is committed by men between the age of 30 and 59. The root cause seems to be family problems.
For the next hackathon, I partnered with Deekshita and Pragnya. This time, our trio found another social issue to work on which was ‘Crimes in India’. Furthermore, we prepared a simple Infographic by taking insights from the data. The output we got was an infographic I am pasting below.
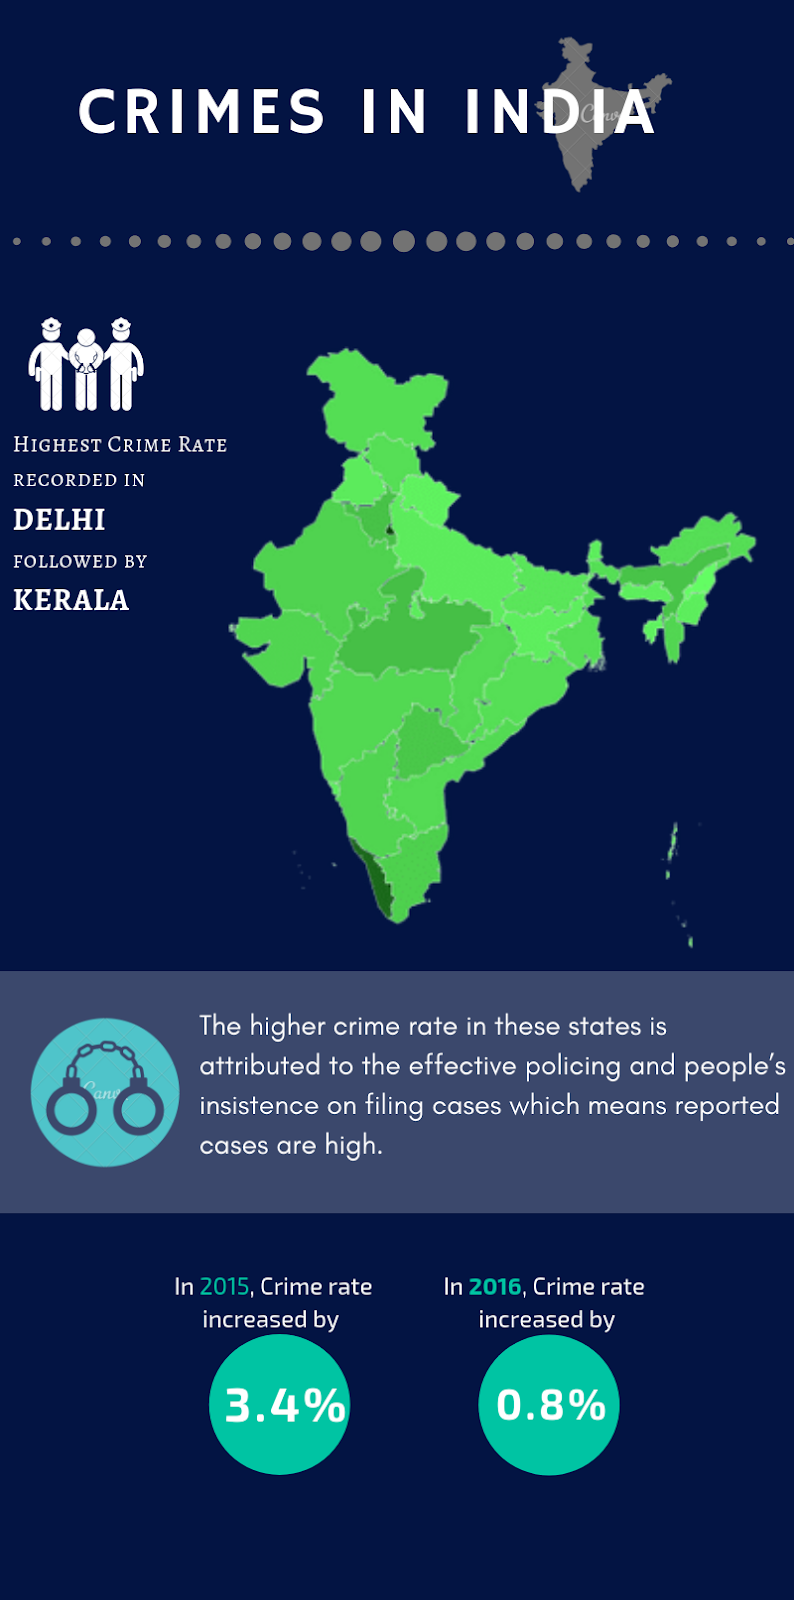
We found out that as of 2016, Delhi has the highest crime rate (974.9) followed by Kerala (727.6).
The state with the lowest crime rate is Nagaland (57.6). It was a surprising fact that Kerala, a state with the highest HDI (Human Development Index), ranked higher than states like Uttar Pradesh or Bihar.
It was very fun and interesting to participate in the hackathon. There is so much to learn from the people at Gramener. When I checked other’s work from the hackathon, it amazed me. I thought about making such data stories on my own. Luckily, everyone here is ready to help me anytime. Finally, I am very grateful to all the people who are helping me learn the concept of storytelling with data.
Note: This article is authored by Padma Lahari, who works as a trainee data science engineer at Gramener.
Read Pranav Vadrevu’s experience during his internship at Gramener. Pranav is an undergraduate Computer Science student at the University of Waterloo.
Read Sandipan Chakraborty’s Journey as a Data Consultant at Gramener. Sandipan talks about the difference between a project manager and a data consultant. He also talks about the strong learning culture at Gramener.
Very nice story telling with proper data visualization.