
Excerpt: In this episode of the data storytelling hackathon, the participants played with data related to films and awards across the globe. The blog shows multiple movie data visualizations and data stories produced during the hackathon.
People may forget you, but they never forget how you made them feel.
Movies are Magic.
Movies are an art form, that impact people’s mind. People love stories, and movies are stories and experiences that we might never have in real life.
But how much do we really know about the hidden numbers and facts from the film industry?
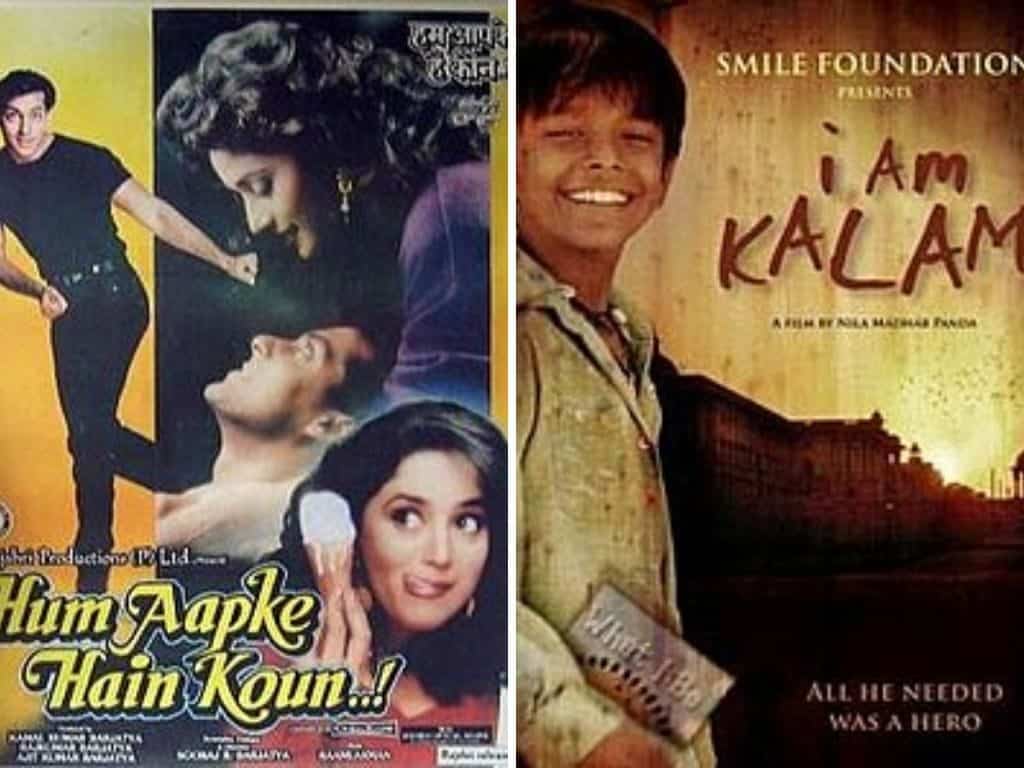
For example, Did you know that the total time of all the songs from the film ‘Hum Aapke Hain Kaun’ is equal to the total playtime of the whole movie ‘I am Kalam’.
Movie Data Analysis, Visualizations, and Stories
For a recently organized data storytelling hackathon at Gramener, we challenged the participants to analyze film datasets. The objective was to create movie data visualizations and stories. We did not restrict the participants on the formats of stories and they were free to choose any format, e:g: infographics, GIFs, videos, etc.
The film industry is full of awestruck moments, which many of us ignore.
For example:
- The global film industry is worth $136 Billion as of 2018. Hollywood remains the largest in terms of box office revenue.
- Indian Cinema, fondly called as Bollywood, is the largest national film industry in terms of the number of films produced and the number of tickets sold.
- Approximately, 3.5 billion Indian movie tickets are sold worldwide annually (compared to Hollywood’s 2.6 billion tickets sold annually) and over 1,800 Indian feature films are produced annually.
During the hackathon, participants tried to transform such numbers into stories. Why? Well, stories are memorable. Wouldn’t you want to remember every fact about your favorite movie?
Movie Data Visualizations and Stories from the Hackathon
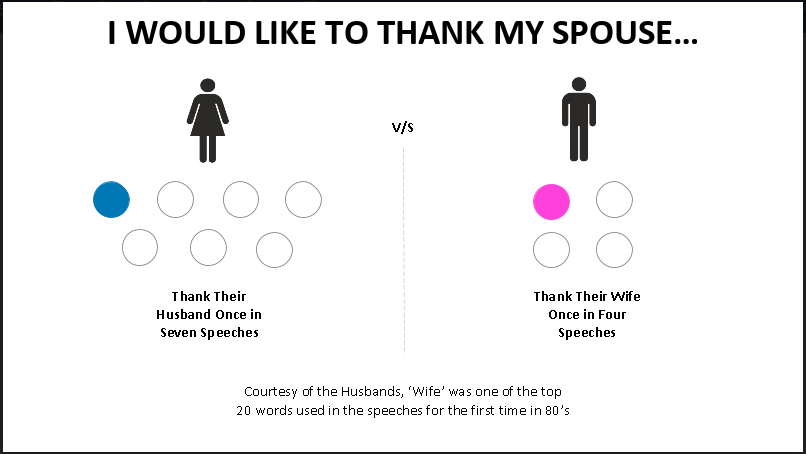
1. Dissecting Academy Award Speeches
The Academy Awards or the Oscars is an appreciation for artistic and technical merit in the film industry. Arihant, Ikhita, and Sriyansh played with the Oscar speeches and created the stories as presentation. For example, did you know that ‘Wife’ was one of the top 20 words used in the Oscar speeches for the first time in the 1980s?
Also, the word ‘writers’ failed to get more than 20 mentions in a decade and was never in the list of top 20 words.
2. The Colorful Case of Movie Posters
Movie posters have evolved largely since the dawn of movie releases. Preeti, Shravani, and Selvanath created a story on the history of movie posters and the evolution of colors in them during 1980-1990.
They collected posters of movies with an IMDb rating of 8.0 or above. After analyzing each poster with Adobe Kuler, they extracted the base hue on the HUE-SATURATION-VALUE MODEL of each poster.
Did you know that in earlier days, movie poster designers used a particular set of colors for each genre of movies? The participants could precisely identify which color sets were used for which genre.

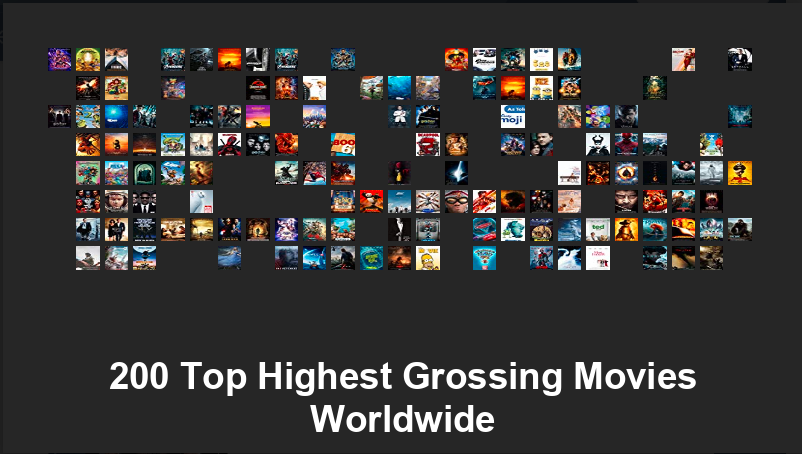
3. What? Only 2 Comedies in 200 Top Highest Grossing Movies Worldwide?
It seems to be true that there are only 2 comedies – Hangover II and Meet the Fockers – that made to the list of 200 top highest grossing movies of all time. Gramener’s Devarani and Akshay gave a glimpse of all the 200 movies that made it to the top in one simple presentation.
Comedy is a vital ingredient in life and moviemakers produce hundreds of comedies every year. Hopefully, we will see more comedies attaining the mark soon.
4. The Fight of Comedy and Drama
In the above story, we saw how only 2 comedies made it to the list of top-grossing movies. However, there’s a surprising element. The count of released comedy movies from 2008 to 2016 has been high compared to other genres. Drama has been a constant contender of comedies throughout.
Gramener’s Mownika and Ashwary created a story that illustrates the list of genre-wise movies from 2008 to 2016. Check out the video.
5. The Colorful Facts of Bollywood
Did you know that the total playtime of all the songs in the Bollywood movie ‘Hum Aapke Hain Kaun’ is equal to the total playtime of the movie ‘I am Kalam’.
Gramener’s Sandipan Chakraborty unearthed many such funny facts from the history of Bollywood.
Here’s one more. Another Bollywood movie, Indra Sabha, released in 1932 has 72 songs in it (wondering if I should call it songs in a movie or a movie in songs). This is a unique record that is yet to be broken. Check out the video and find more fun facts from Bollywood.
6. A Timeline of Academy Awards
Akash, Girish, and Brunda created a simple GIF to show a timeline of Academy Awards.
The GIF data story includes the name of the Oscar-winning stars, their nomination categories, and movies for which they won the Academy Award.
7. Jolie No. 1: Ticket to Hollywood
There are more Bollywood actors in Hollywood. Some are even turning down Hollywood roles. There’ve been discussions on the authenticity of such remarks. For example, Bollywood actor, Govinda, confessed on air that he turned down a role in 2009 fantasy movie, Avatar. Beat that.
Imagine if Govinda announces that his next movie would be with Angelina Jolie, and the movie is titled “Jolie No. 1.”
Imagine further, that he announced that a co-star connected them, but declined to say who.
Who might this co-star be?
Anand, Kishore, and Niyas explored the social network of actors and found the most likely chain of co-actors that can connect Govinda to Angelina.
Check out the video to know the enticing journey of Govinda to Hollywood.
Check out Data Stories from Previous Hackathons
The Data Storytelling Hackathons is a tradition at Gramener. We organize it on the 2nd Friday of every month. For more data stories, check out the links to our early hackathons.
- Data Talkies: Video Data Stories and Visualizations with a Play Button
- Physical Data Visualizations: Did you know, you could touch data?
- Visual data Storytelling examples to inspire you to create data narratives
- Data Storytelling Bootcamp bestowed a flood of insights and stories
- 14 Data GIF Examples For New-age Data Storytelling
Join Us for the Next Data Storytelling Hackathon
With Data Storytelling Hackathon every month, we learn new formats to present data insights. We learn to make data more exciting.
Data enthusiasts from Bangalore and Hyderabad come together to celebrate the second Friday of every month with data, visualizations, and stories. You can join us any month by registering through meetup.
Explore More Secrets of Data Storytelling with Our Workshop
Yes! We do organize data storytelling workshops for data scientists and analytics experts. We identified that it is easy to extract insights but difficult to convey them in a memorable manner. Thus, our workshop focuses on introducing new techniques and formats of data storytelling and enable business users to create insightful data stories rapidly.
Finally, did you find your favorite movie anywhere in our data stories? Comment down and let us know. Share these data stories with your movie-buff friends. If you have an interesting movie data visualization or story to tell, do share with us over email at contact@gramener.com or tag us on social media.
very nice articles
Thank For post “Movie data visualizations data storytelling”
I haven’t released to date that data visualization can be so effective and creative.
I especially love the post and it will be useful to me in my presentations reports.