
Every successful story (novels, movies, songs) is full of details, strong characters, and emotional backgrounds. The same goes for a data story too. In this article, we’ll share 5 data storytelling tips that will help you organize your data stories.
The task of a data storyteller is to convey actionable insights, evoke emotions, and help stakeholders make decisions. However, there are two important steps that you need to complete before forming a data story – define an audience and find insights to support the story.
In one of our data storytelling articles, we talked about how to create insightful data stories. Do check it out.
Why Data Storytelling?
Data is a collection of numbers, which hides meaningful and actionable insights. These insights can be identified as patterns when we analyze and visualize the data. But, showing visual dashboards to business executives without a narrative can be a bit overwhelming. They might find it difficult to consume the insights, let alone the visuals.
Every narrative or story must convey a message. A data narrative with proper message draws the audience’s attention to the patterns and sparks the emotions that lead to making decisions. You can create a data story in any format – text narrative, video, audio, GIF, and many more. However, one thing remains common – an enthralling storyline.
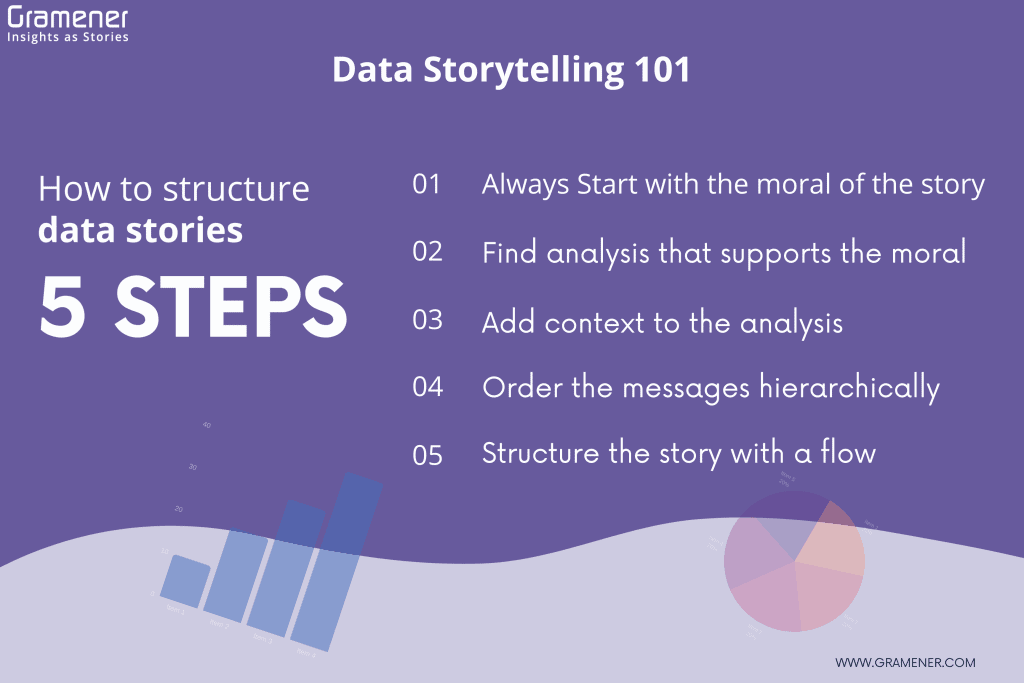
5 Data Storytelling Tips to Structure Data Stories
A storyline binds the data, insights, and narrative into one thread. You can say that a storyline is the face of your data story. Basically, storylines are plot outlines, based on which a data scientist or analyst explains a story in a structured format.
Include these 5 elements in your data story to make it stand out.
1. Data Storytelling Tip #1 – Start with the Moral
All powerful stories are woven around a moral. All of them concentrate on one single actionable takeaway.
Let’s take the example of Acme Corp, a fictional organization. After doing an analysis of their customer data we created a data story on their Net Promoter Score (NPS).
Acme Corp’s NPS improved by 6%. It was 34% in the previous quarter. It’s 40% in this Quarter. Despite lower satisfaction with support, Acme’s NPS grew. This increase in NPS was mainly due to better product quality & research.
Here, the story has one key moral – Acme’s NPS improved by 6% due to product quality and research. The rest of the elements in the story such as the quarterly comparison of NPS are building blocks that are important to the story.
2. Data Storytelling Tip #2 – Build Analysis to Support the Moral
In your data analysis, you might come up with multiple analyses and insights. But, you can’t include everything in your story. You need to pick only the ones that support the intent of your story. This can be termed as a classic editing process of getting rid of irrelevant content.
Pro Tip: Take help from an editor who is independent of the analysis team. Data scientists and analysts can be biased towards including every insight in the story. But, an independent editor will only pick the ones that align with the moral.
Use the following checklist to ensure reasonable edits.
- List all possible analyses
- Reword them as sentences
Strike off what’s not relevant to the data story
3. Data Storytelling Tip #3 – Add Context to Analysis
Adding context to the analysis makes room for the key messages. There are 3 ways that you can add context to the analysis.
a. Comparison: You can create a comparative scene that can help a business user consume the information. For example, a regional sales head wants to compare the sales over periods. Here’s the story – “Our $16 million sales is $4 million more than last year, $1 mn below budget, and twice our nearest competitors.”
This context packs the overall sales, targeted expectations, and competitors’ analysis in just one line.
b. Analogies: With an analogy, you can utilize the audience’s prior knowledge to explain your concepts. Here’s an insight that would help the inventory head of the logistics company. “If we stopped producing, it’ll take 3 months to dispose of our excess inventory of $2 mn.”
c. Interpretation: Sometimes you need to concretize the findings. For example, it is understandable that discounts are proportional to the number of people buying a product. You can make this insight more credible by adding a context such as “Usage is correlated with discounts. For every $1 discount, customer lifetime value increases by $24.”
That’s a straightforward RoI of 2,400%. Now, this insight and story can never go unnoticed as it has a significant benefit listed for the business user.
4. Data Storytelling Tip #4 – Arrange the Message in Order
A story should be in a sequence and proceed dramatically so that the audience remembers it for long. You can construct a pyramid or tree-like structure where each part of your story (analysis, insight, and narrative) is hierarchically connected. Keep the moral/insight of the data story at the root and start adding supporting context on top of it.
Strike off the analysis that doesn’t add value to the root. For example, let’s take the scenario of a company where we analyzed that the launch sales of a product were 30% less than the target. It happened due to high competition. This is the root of your tree. The following sub-points are to support the insight and answer why that happened.
- Competitors discounted price by 35% – which is unsustainable for our company
- Launch sales were projected at $20 million in the first month but achieved only $14 mn
- Stores offered higher discounts saw less than 20% of our target sales
A structured data story is easy to consume and clearly highlights the hows and whys. It is arguably the most efficient way of communicating business information.
Pro Tip: The headline [Insight] comes first, the subheadings [Context] next, and then the content [Reasons].
5. Data Storytelling Tip #5 – Add Flow to the Story
Now you know why sequencing your data story is important, let’s talk about elements that make your story consumable. Here are 7 flows that will help you structure your data story from different angles. But remember, the motive of every flow is to drive actions and evoke emotions.
a. By time
You can set your story by conveying the insights from past, present, and future. For example, the sales were $15 million last year, it is $20 million this year, and is projected to be $25 million next year.
b. By place
You can convey a data story by noting the status of the business in various regions. For example, the sales are down by $2 million in North America but are on target in the Asian market.
c. By aspect
You can convey a data story by bringing out some aspects of any company or competitor. For example, compared to our competitors in the North American region, our sales for a similar product has improved by 35%.
d. Benefits
You can talk about the benefits of your storyline. For example, after our new marketing strategies, the lead generation per month doubled with a rate of 3 leads per day.
e. Scale
You can include the insights from your business on various scales such as regional, national, or global. For example, the TV viewership of our channel is 25% higher than the national average due to a higher number of regional language programs.
f. Balance
You can list some pros and cons in your data story. For example, although there was a growth of 20% in our steel production, the workers are suffering from sleep deprivation due to overtime.
g. Priority
Sometimes analysts come up with a bunch of insights and all are important. In such cases, you can drive the flow of your story by prioritizing a set of insights based on the level of severity.
Using these data storytelling tips you can create data stories by focusing on Big, Useful, and Surprising insights. You can also check out our PPT that lists all the data storytelling tips, right from creating a storyline to executing data stories. The PPT is explained in the webinar on data storytelling organized by Analytics Vidhya and hosted by our CEO, Anand S.
Apply the Data Storytelling Tips and Share a Story with Us
A data story doesn’t always have to have a happy ending. Sometimes, businesses fail and that could be a huge motivation for taking necessary actions. You just need to convey facts and insights in a manner that imprints a sense of action in your customer’s mind.
Always remember, a good data story should be crisp and should have insights that matter the most to the customer. Emotional, data-driven decision making should be the end goal of a data story.
For more data storytelling tips, contact our workshop team. Yes, we do organize data storytelling workshops for business executives. Check out the agenda, benefits, and process of our data storytelling workshop where you and your team can get hands-on experience to exercise data storytelling techniques.
We hope that this article was helpful. Do share it with your friends and fellow data enthusiasts. Use these data storytelling tips to create impactful stories and tag us on social media (@gramener).