
On 27th April 2020, six interns joined us, and we wanted to introduce them to the team. We were thinking of creating a graphic welcome poster that we could share within the company, one which the interns could also share on social media. Being a data storytelling company, we thought, why not do something which includes data? That’s when we zeroed in on making data portraits.
What is a data portrait?
While portraits capture what a person looks like, a data portrait captures the essence of a person using data points about them. For each of our interns, we collected data about their preferences. We then put them together to give a colorful depiction — the data portrait.
We’ve created a series of data portraits of celebrities as a tribute for their achievements. Check out the data portrait of Lionel Messi, Sachin Tendulkar, and Bill and Melinda Gates. We created a data portrait of Donald Trump, which is a compilation of all the tweets from his official Twitter handle.
Visualizing personal data as Data Portraits
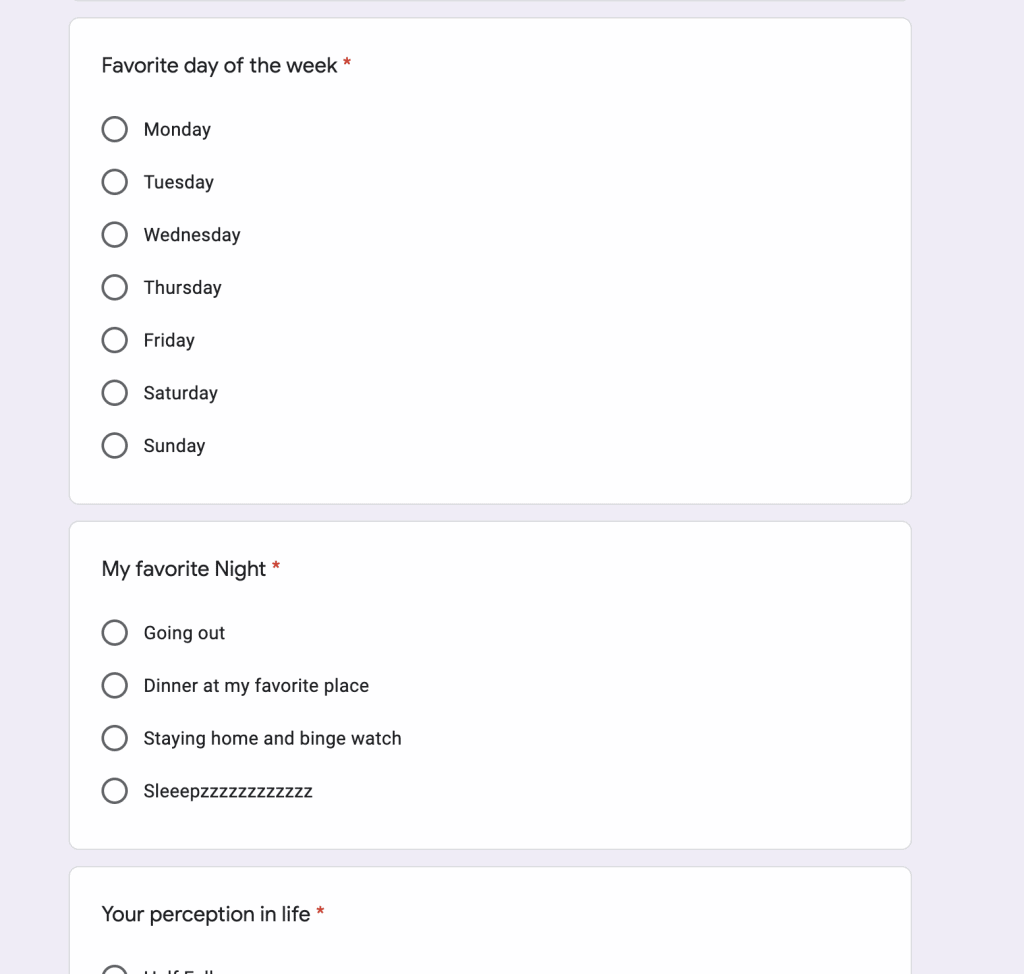
Step 1 – Data collection through forms
We created a Google Form with a few simple questions like “What is your favorite day of the week”, or “What do you prefer to use while brainstorming”. These questions had a list of answer choices, and the interns could select only one radio button.
Step 2 – Ideating on data portrait elements
We wanted this to be quick yet something that looks like illustrative art, keeping in mind that it’s not too complicated. I started with paper sketches.
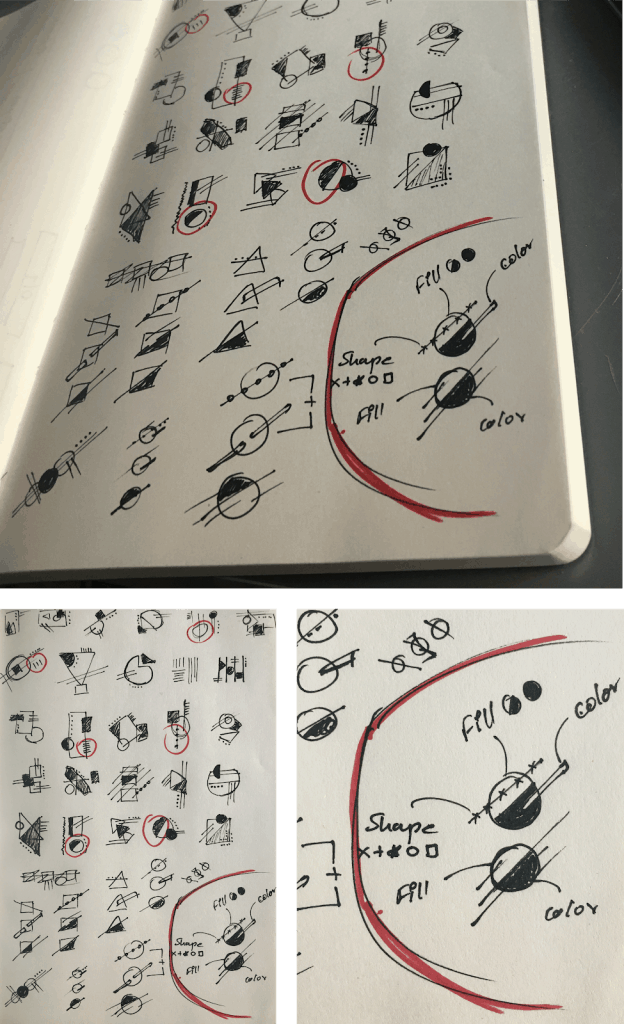
After multiple sketches, I decided on having two main circles with each half to convey some information. Dividing the first circle into half, one portion to show gender and the other to show the tool of choice by color-coding.
The second circle was divided by color to represent one fact and fill for the other. The remaining information was added by overlapping elements on the circle.
Step 3 – Tool to make data portraits
As we were doing this for a limited number of people, I chose to do it on Sketch. I started off creating the skeletons.

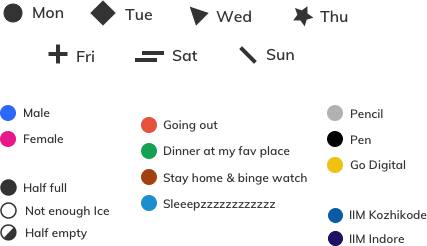
Color-coding and shapes
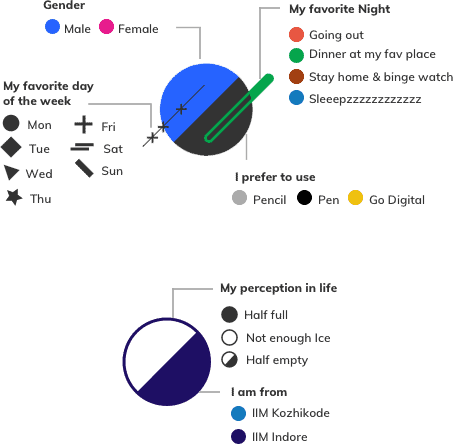
The colors and shapes were to be selected in a way where if all the data portraits were compared, one can easily differentiate them and get insight out of it. So here’s what I chose:
- Days of the week: I chose to use shapes for this as there were seven values, and using colors to indicate more than five values is not advisable.
- Gender: I went with the universal colors for these, blue and pink.
- Tools: Here, I chose the color that the selected tool would have – shades of grey, light for pencil, and dark for a pen. Going digital was a complete opposite, and hence I chose a contrasting color.
- Education institute: Here, the colors were similar to the institute’s logos so that the interns could relate to them quickly.
- Perception of life: The circle was colored according to the institute’s colors. But I chose to play with the fill that matched the answers. For example, half colored circle for the perception that life is “half full”.
- Type of night: Here, the choice of color was close to the environment/mood, but I also had to ensure that it did not match with the other colors on the portrait.
Putting it all together
Adding data
Once all the colors and shapes were frozen, I started adding data for each intern. As soon as I was done adding data, a few insights popped up.
- No one said their fav night would be “Sleepzzz”. They preferred to “Go Digital”. And the majority’s perception was that life was “Half empty”.
- Most find the weekend to be the best day of the week, with only one answering start of the week.
- Fav night had no clear winner. It was equally divided between “Going out”, “Dinner at my fav place”, and “Stay home & binge-watch”, but no one wanted to just sleep.
- Only one intern said their perception of life was “Not enough ice” rest all have their glass “Half full”.
- Most of them preferred a “Pen” as a tool, while only one would use a “Pencil”.
Adding details and layout to data portraits
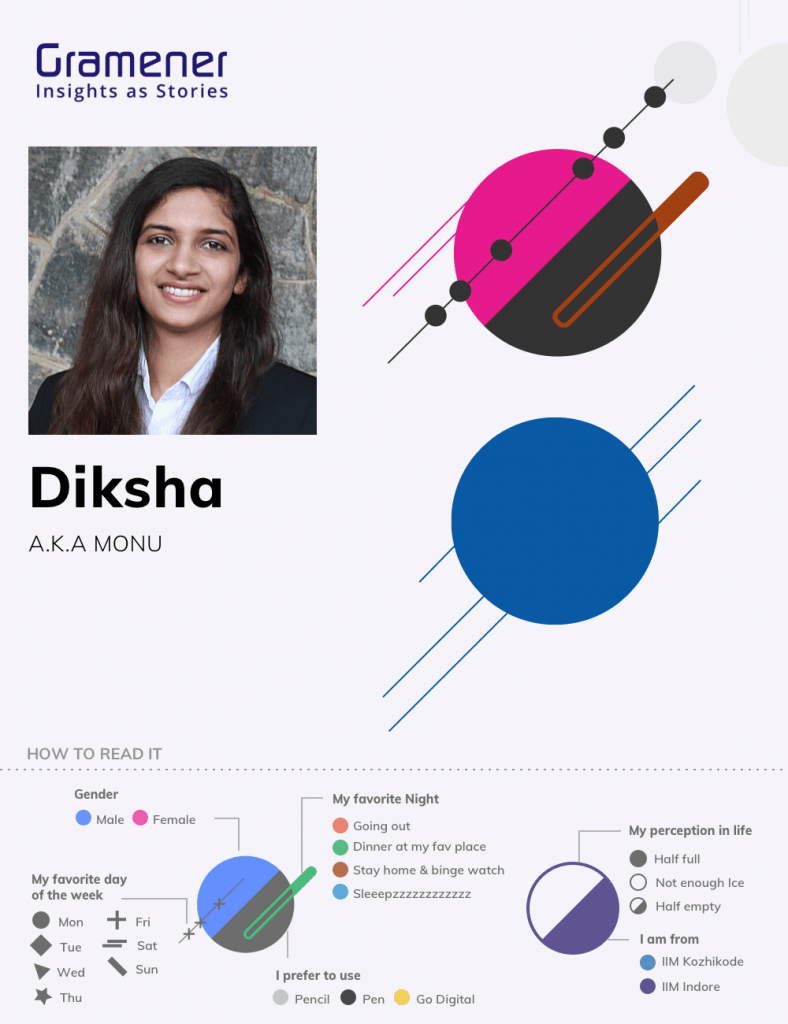
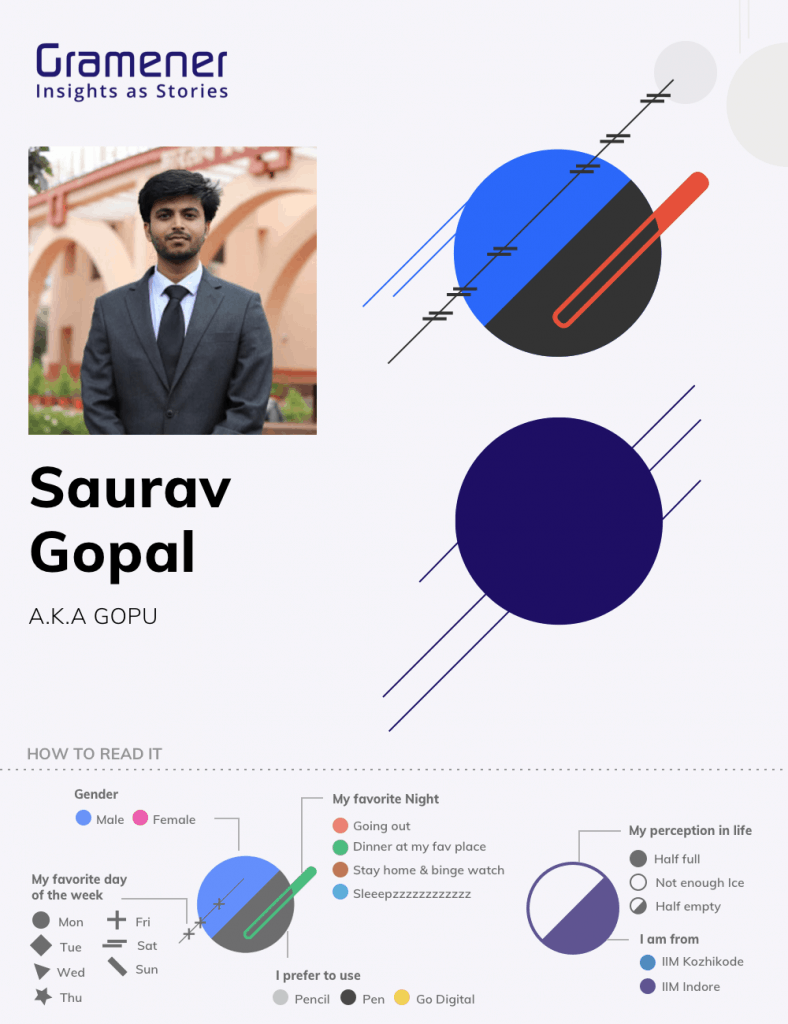
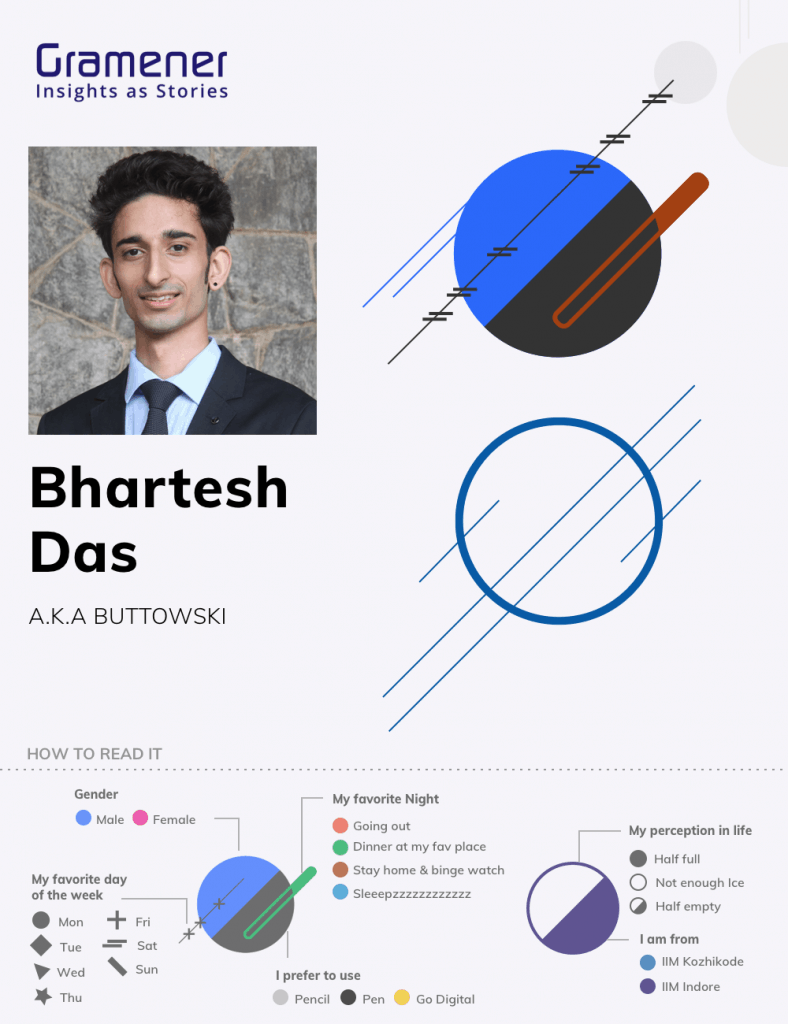
I divided the canvas into two vertical halves, with one side containing all the information that was direct and not part of the portrait, like name, nickname, and image. This left the other half for the data portrait itself.
Know our new members through data visualizations
Diksha is from IIM Kozhikode and has joined us as a Growth Marketing intern.
Saurav is from IIM Indore and has joined us as a Growth Marketing intern.
Bharatesh is from IIM Kozhikode and has joined us as a Data Consulting intern.
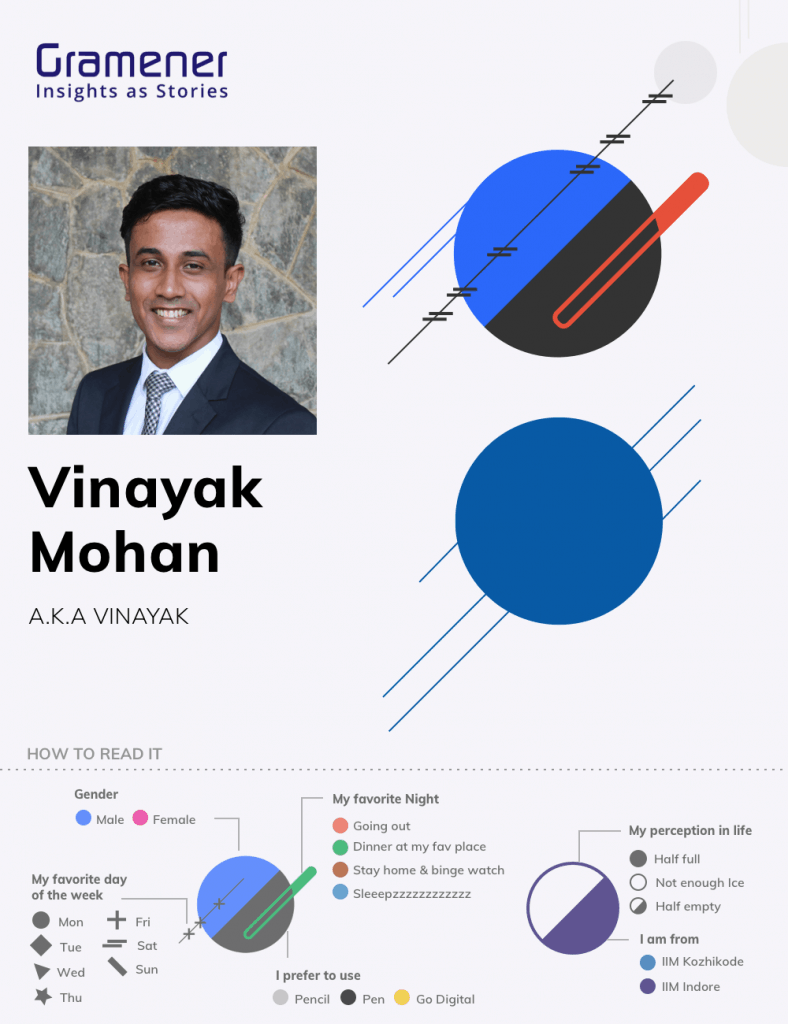
Vinayak is from IIM Kozhikode and has joined us as a Data Consulting intern.
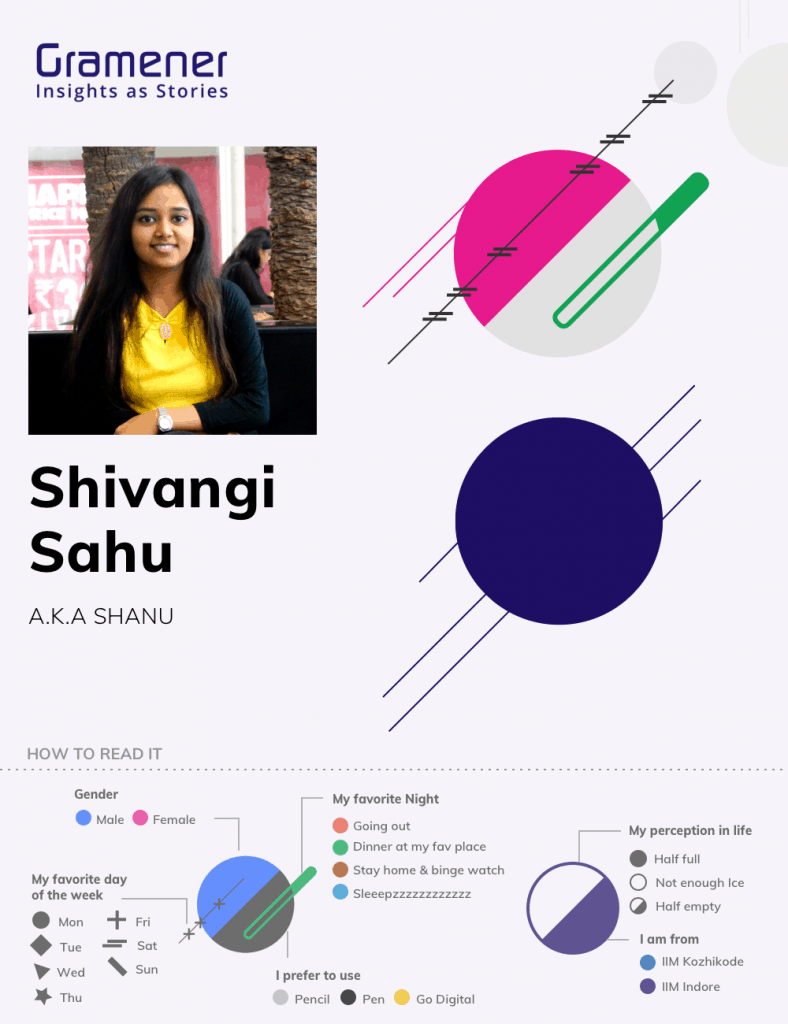
Shivangi is from IIM Indore and has joined us as a Data Consulting intern.
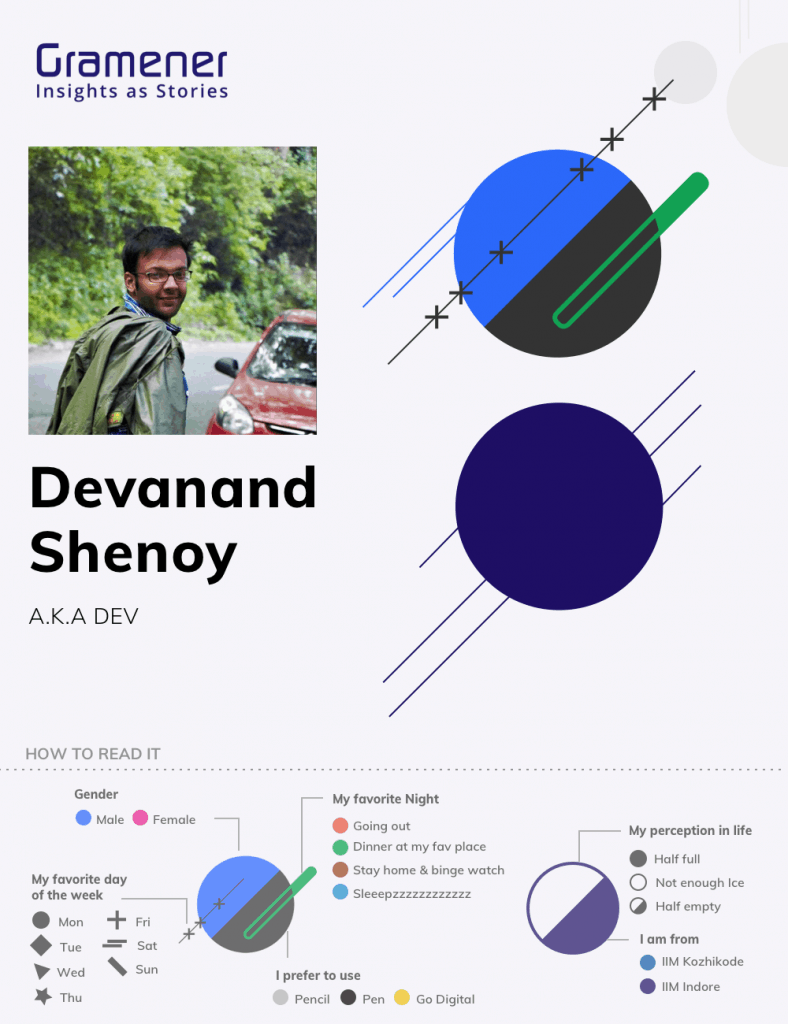
Devanand is from IIM Indore and has joined us as a Data Consulting intern.
Data Portraits as personalized bookmarks
People at Gramener love to play around data and find innovative ways to visualize it. Sometime back, Story Labs at Gramener created bookmarks visualized with personal data. Here’s an article that talks about capturing people through data.
Did you like the data portraits? Let us know in the comments. Do share the article with your friends and data visualizers. Finally, we hope that you follow the steps to create one for yourself and your friends.
Excellent superb