
With 96.2K people affected so far with Covid-19 in India, it is among the top 15 most affected countries in the world. About 3,700 samples have tested positive for Covid-19 every day for the past 15 days in May 2020.
However, an important indicator we need to track is, how many samples are we testing in the first place? How can we understand whether states are testing enough? ICMR releases this data on a daily basis. Can we take this at face value or are there any derived metrics suggested by researchers?
This blog post focuses on understanding the samples tested data released by ICMR and what insights can we get from the data. Bhasker Reddy, Principal Data Consultant at Gramener, curated this article while Sidharth Vyasabattu, intern at Gramener, helped collect the precise data required for the analysis.
Understanding COVID-19 testing scenario across locations
Researchers and experts have suggested two derived metrics to understand the testing scenario at a given location.
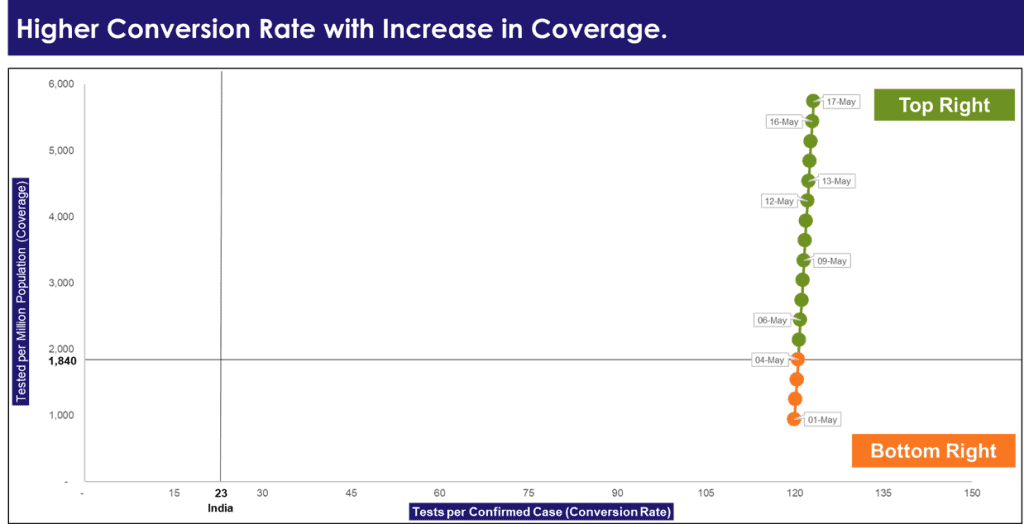
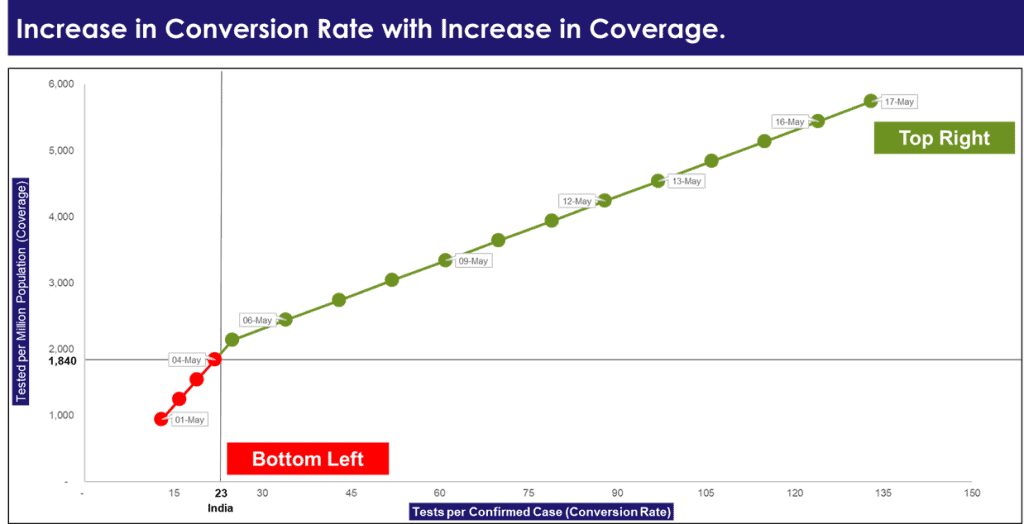
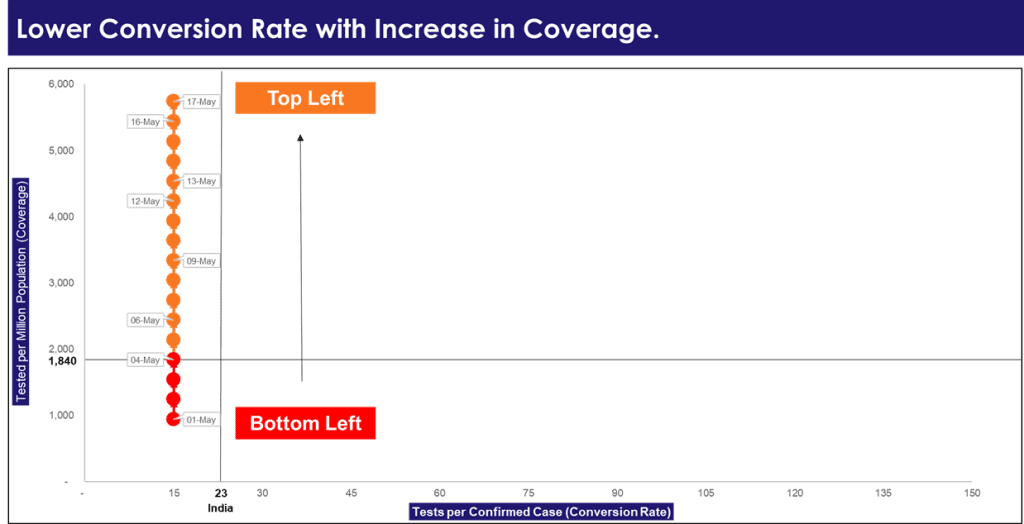
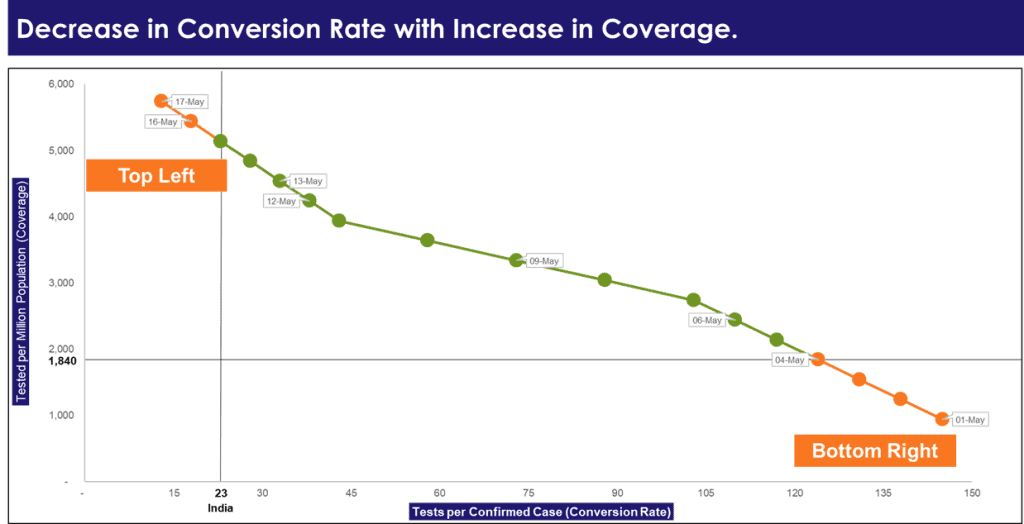
- The first is tests per million population (Coverage): This metric represents the number of people covered in a location based on the density. A higher number of tests doesn’t mean coverage is good as it also depends on the population in that location.
For example, Maharashtra, with 2.7 lakh samples tested as on May 17 is the second-highest in India. However, its coverage is just half compared to Andhra Pradesh (Though it has tested only 2.4 lakh samples). - The second metric is no. of tests per confirmed case (Conversion rate). This metric represents how many samples are tested before identifying a positive case.
When we look at these two metrics together, they give a more holistic picture of testing in a location. When testing increases, it will lead to a higher number of cases in a location, and eventually, will ensure that there are no more cases in that location.
Identifying positive signs
If the conversion rate increases with coverage, then it is a sign that there are fewer cases in that location and it is in better control of pandemic.
Identifying negative signs
Conversely, when you increase the coverage and there is either a reduction or mild change in the conversion rate (which is already low), then there are more undetected cases in that location. It is a sign to increase coverage and scale-up testing extensively until the conversion rate shows an upward trend.
Though there are some limitations to this logic. There no measure to identify the effectiveness of contact tracing in a location, which gives us a fair picture of the testing situation.
Comparison with the benchmark (National avg.)
On the basis of these two metrics, I have generated an index value (Testing Response Index) for each state, with India as the benchmark (weighted average of the states) as there are no other benchmarks available.
- Green – Good performer, low conversion rate and higher coverage compared to average
- Orange – Average performer, either higher conversion rate or lesser coverage compared to average
- Red – Bad performer, higher conversion and lower coverage compared to average
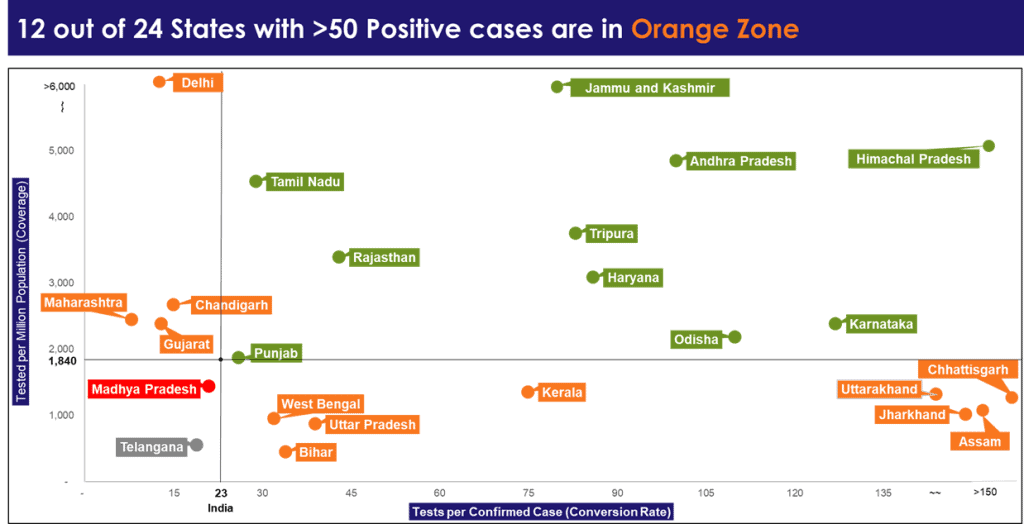
Now, let’s take a look at one state from each zone.
Insights from a few states on COVID-19 testing data
Karnataka
Karnataka is among the better performing states with a conversion rate of 127 and coverage of 2,380 better than the average 23 and 1,840 respectively as on 17th May.
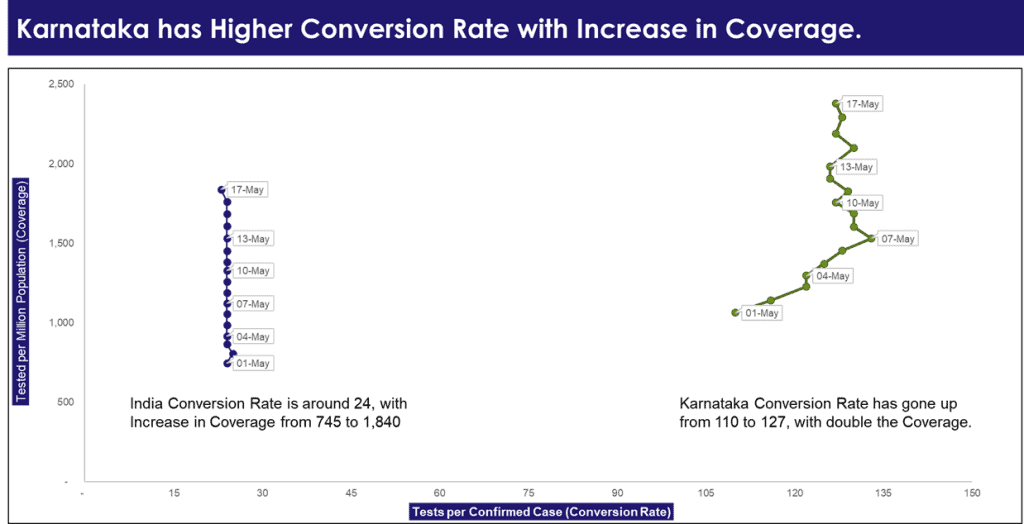
The state has identified 42 laboratories to test samples. On an average, they test around 5,000 samples per day, of which around 34 cases turn out to be positive in last 15 days.
The trend in the past 15 days shows that the conversion rate has increased from 110 to 127, with an increase in testing coverage from 1,062 to 2,380. The trend shows that they are in better control of the pandemic.
Maharashtra
Maharashtra is among the average performing states with a conversion rate of 8, highest among all states. The coverage of 2,439 is slightly higher than the national average as on 17th May. The 33,000 cases in the state account for 34% of the cases in India with a fatality rate of 3.6%.

They have identified 66 laboratories to test the samples, the highest in India. They test around 8,100 samples per day on average, with around 1,300 cases turning out to be positive.
The trend in the past 15 days shows that the conversion rate has decreased from 13 to 8 with an increase in testing coverage from 1,283 to 2,439. The trend shows that there are more unidentified cases in the state as there is a reversal.
They should continue or increase the testing rate to gain control over the pandemic. Though they have enhanced testing in recent times, there is still scope for improvement.
West Bengal
West Bengal is among the average performing states. The conversion rate stands at 32 (among top 10 states in India) and the Coverage stands at 942, below the national average.
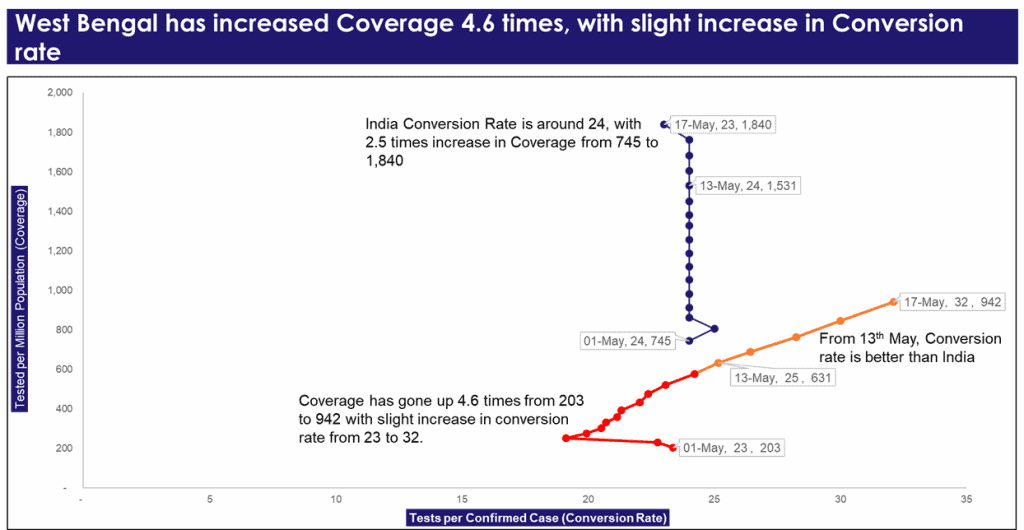
They have 30 laboratories to test samples. On average, they test around 4,200 samples per day with around 110 cases turning out to be positive.
The trend over the past 15 days shows that the conversion rate has increased from 23 to 32, with a jump in testing coverage from 203 to 942. Though they have ramped up testing recently, they are late in identifying the cases, with a fatality rate of 8.9%, the highest in India. They need to set up more labs and enhance their testing rate extensively with a strategy.
Madhya Pradesh
Madhya Pradesh is another state with scope for improvement. It is among the low performing states with a conversion rate of 21 and the Coverage at 1,431, both below the national average.
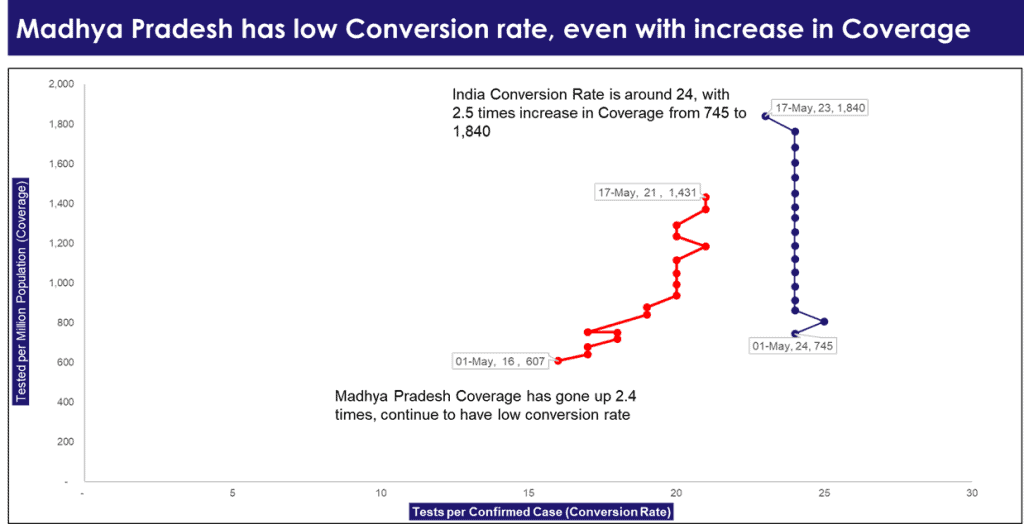
They have identified 18 laboratories to test the samples. They test around 3,700 samples per day on average, with around 140 cases turning out to be positive.
The trend over the past 15 days shows that the conversion rate has a slight increase from 16 to 21, with an increase in coverage from 607 to 1,431. The fatality rate stands at 5.0%, the third-highest in India.
It could also be an indication of the late identification of the cases, which may have lead to death. The trend shows that there are more unidentified cases in the state. The state needs to set up more labs and enhance its testing rate extensively to get a hold on the pandemic.
Telangana
With 1,551 cases registered so far, it is the 11th most infected state in India. The cases are growing at an average of 30 per day from the last 15 days. There has been a sudden increase in cases with 350 registered in the last 7 days. Hyderabad, the capital city, accounts for 63% of the cases.
They have identified 21 labs for COVID testing. However, they are not publishing testing data for the past 20 days (They have last published only till 29th April).
For Data Enthusiasts
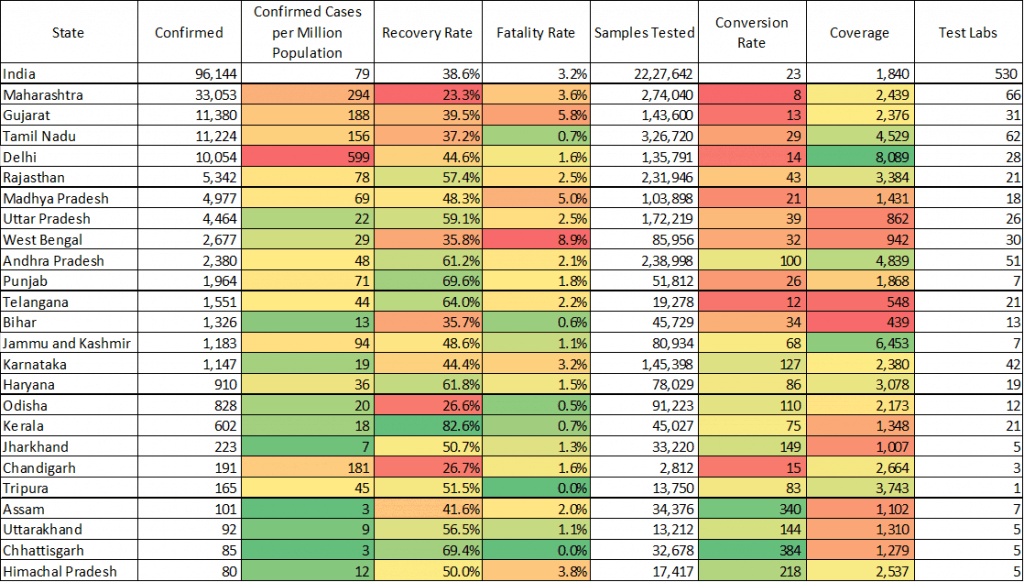
India has tested 22.2L samples so far with 1,840 Coverage and detected around 96K cases with a conversion rate of 23 as on 17th May. The below table will give a fair idea about all the states in India with key KPIs listed out.
We Need More Testing Data
ICMR and states should publish granular and frequent testing data with all possible demographic details, testing type, and retesting details instead of state-level aggregated data. This will help researchers and experts analyze the data and aid the government in containing the pandemic.
States have to be better prepared with testing strategies and contact tracing to contain the pandemic, as it will pose more challenges when the movement of people increases. Even after more than 50 days of extensive lockdown, the data points don’t show a rosy picture.
Data Sources
- COVID Cases and Testing data from crowdsourced Covid19India website as on 17th May
- Testing Facilities as on 17th May from ICMR website
- Population from Census 2011
Note: This blog is authored and visualized by Bhasker Reddy, Principal Data Consultant, and Sidharth Vyasabattu, Data Science Intern at Gramener. You can connect with him on LinkedIn and Twitter.
Very clearly explained. Great approach.