
The animated gif is an engaging and useful output format for data stories. When played in a loop, gifs help reinforce the intended message in the minds of the audience. To make it easier for the audience to grasp the message, the sequence of the story needs to be a simple one. This post focuses on using the deductive structure of storytelling to create gifs.
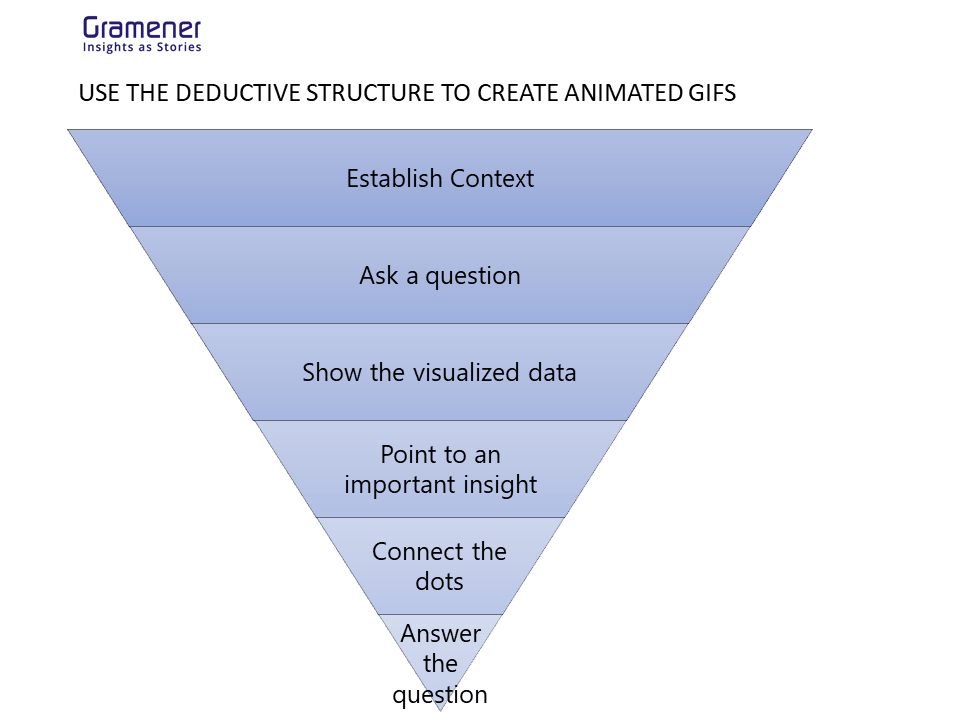
The following is a suggestive structure you could follow while creating a data story gif.
- Provide context
- Ask a question
- Show your visualized data
- Point to an important insight
- Connect the dots
- Answer the question raised at the beginning
Create data story GIFs for storytelling
Here is an example that follows this structure. This example was created using PowerPoint. The text animation is possible using the morph feature available in the Office 365 version.

Let us study the narrative flow of this data story gif. For this example, let’s look into the Robotic Process Automation (RPA) system of ACME, a fictional corporation.
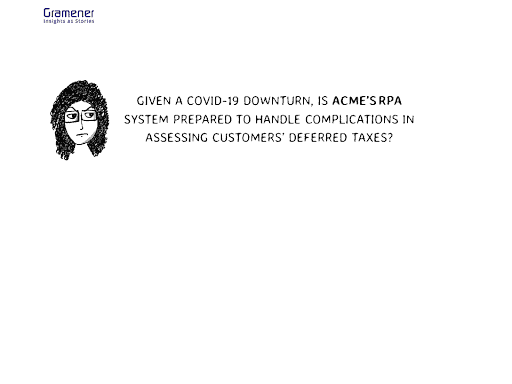
Step 1: Establish the context and ask a question
This could be done in two separate steps or could be combined in one.
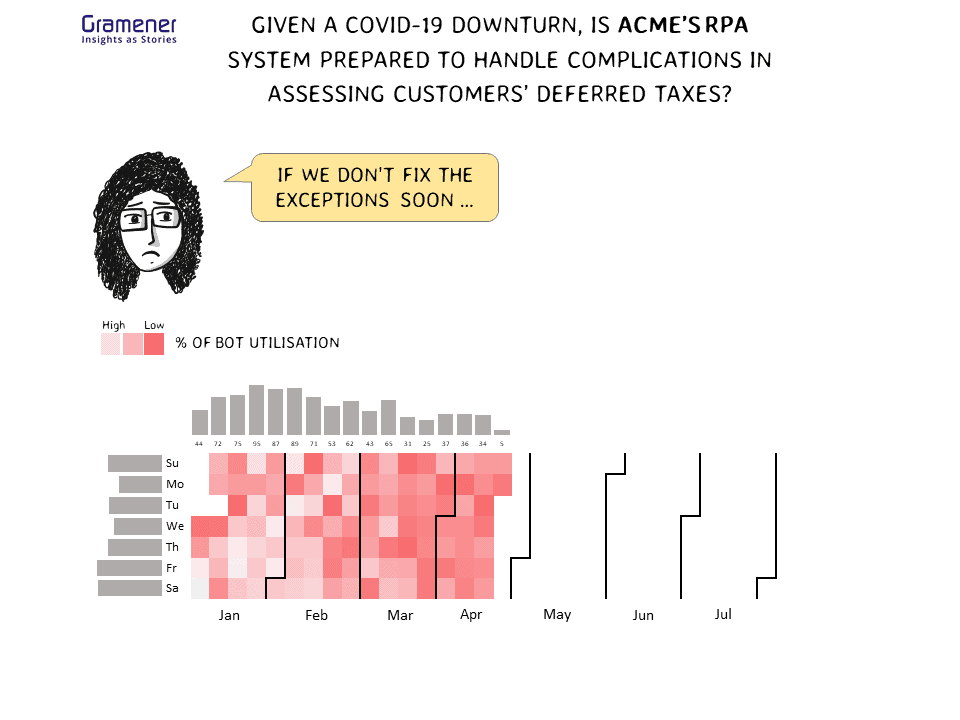
(Context) “Given a COVID-19 downturn, (question) is ACME’s RPA system prepared to handle complications in assessing customers’ deferred taxes?”
Step 2: Show the visualized data to prove your point.
“One way of confirming preparedness is by checking the utilization rates of our bots.”
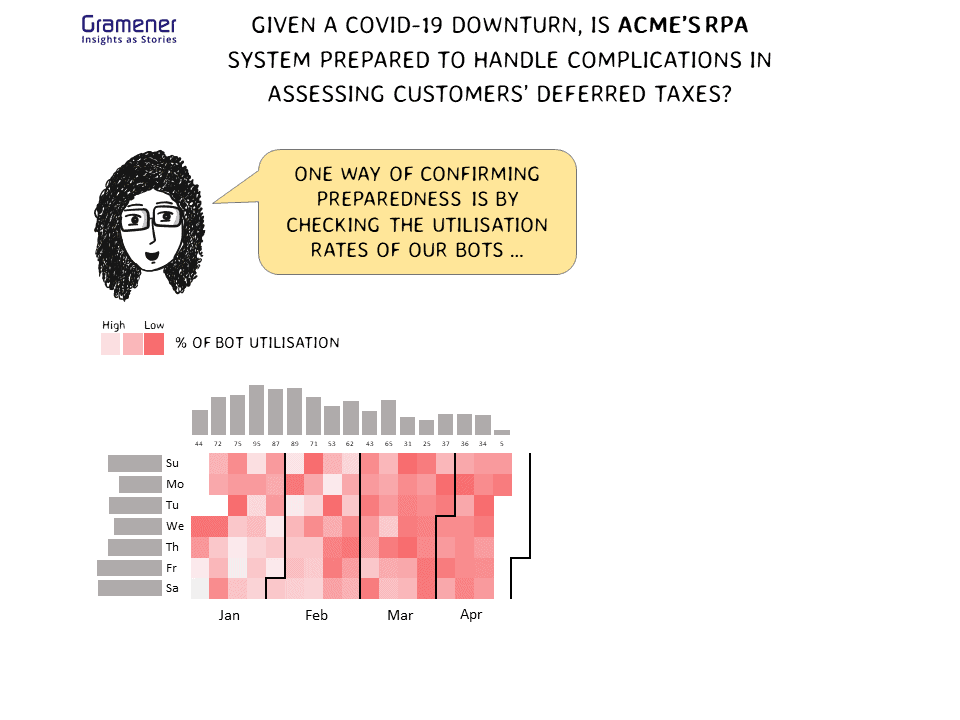
Step 3: Point to an important insight.
Tell your audience what happened and the possible cause.
- What has happened? – “The utilization rate of bots assigned for tax assessment fell in the last 2 months.”

- Why did that happen? – “This is mostly because of an increasing rate of exceptions in a couple of softwares”

Step 4: Connect the dots
Tell your audience about the impact of the insight.
“If we don’t fix the exceptions soon …”
Step 5: Answer the question that you posed at the beginning
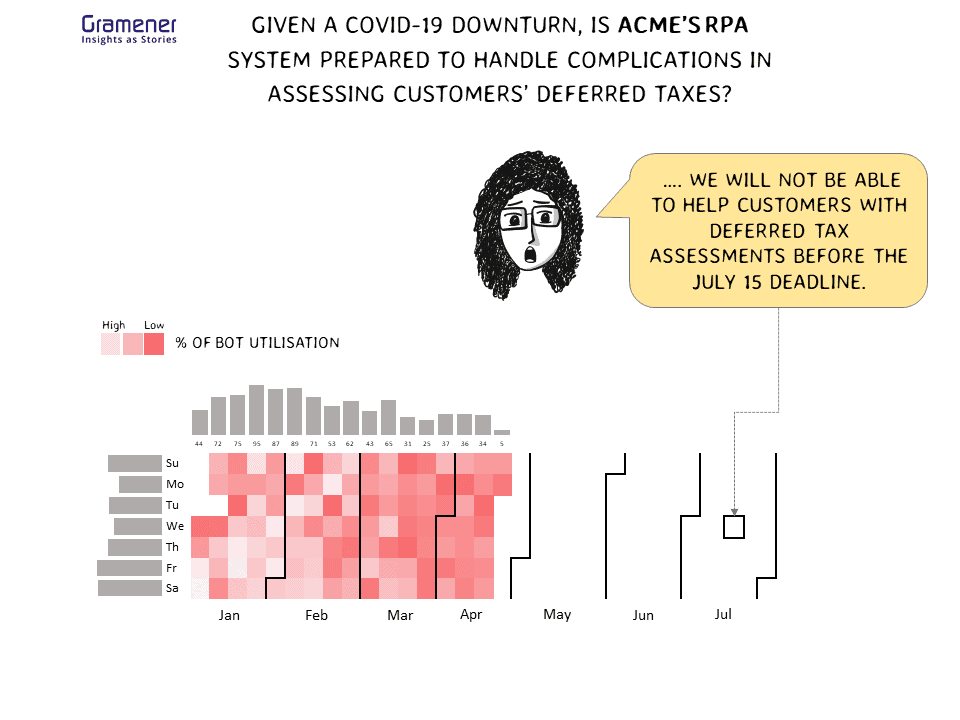
“…. We will not be able to help customers with deferred tax assessments before the July 15 deadline.”
Here are a few other factors can contribute to the successful communication of your gif story:
Use a narrator – A comic character can play the role of a narrator. The emotion displayed by the character lets the reader interpret whether the message they are viewing is good news or not. You could pick a comic character from ComicGen.
Use speech bubbles – The eye is naturally directed to the narration when it is contained within a speech bubble in anticipation of wanting to know what the narrator has to say.
Use pointers – It is useful to point the narration contained in speech bubbles to relevant portions of the visuals.
Why don’t you give it a shot now? Before you pounce on a tool to create the gif, remember to write down the narrative flow to your gif using the deductive structure. All the best.
More resources on comic storytelling GIFs