
Gartner forecasted a couple years back that the global Business Intelligence (BI) and Analytics domain will reach a staggering $16.9 Billion in 2016. With that, Gartner stamped that organizations must work for the evolution of BI and Analytics at a faster clip. A well planned insightful storytelling with data is just what’s missing.
How storytelling with data can enrich BI experience?
Exploring insights in data that a human mind would hardly notice, is a significant function of a BI tool. But these insights are only useful if conveyed in the right manner to the decision-making job functions.
Storytelling technique is the best add-on to a BI tool to convey any insightful information. Apparently, we understand stories, we remember stories. It is highly unlikely to remember the facts but it is certainly easy to remember the facts in the context of a story. That gives storytelling with data an upper hand.
This is the reason we organize data storytelling workshop to help business users, data scientists and analytics experts to help them learn the techniques and structure of data storytelling.
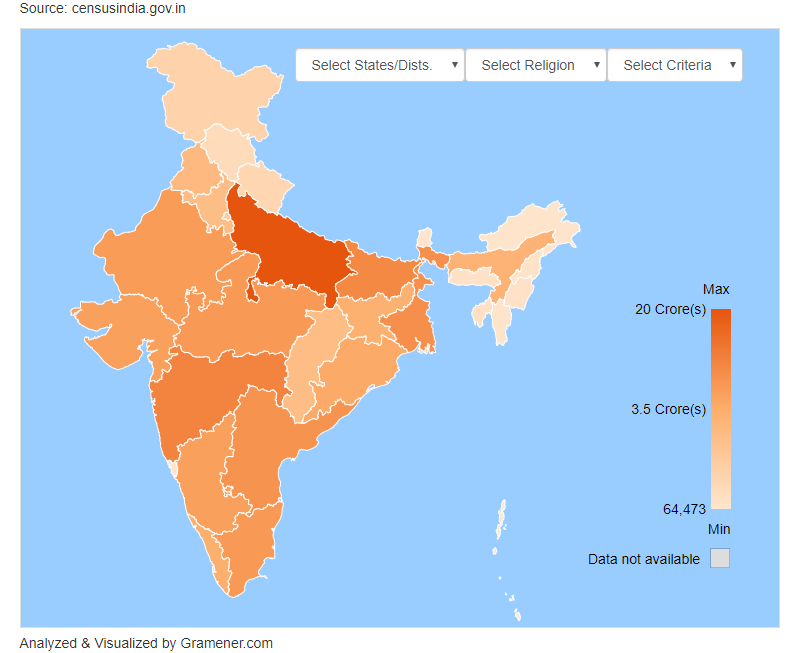
Now, let’s begin storytelling with data with an example. The following is an India map visualization following the common data visualization practices. It is a census data-based visualization to understand the distribution of various religions in the country.
Insights from the visualization
Initially, the map stands unfiltered on the basis of population distribution represented with the shades of brown.
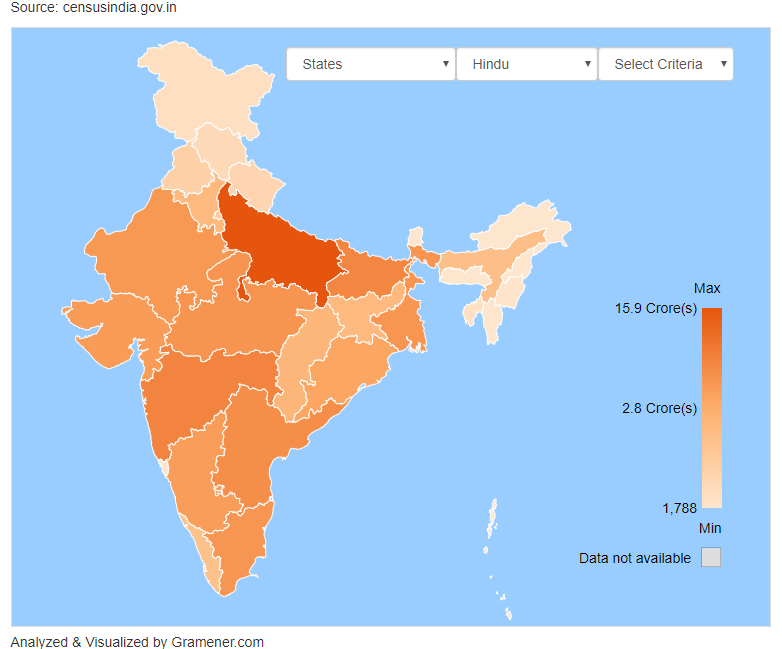
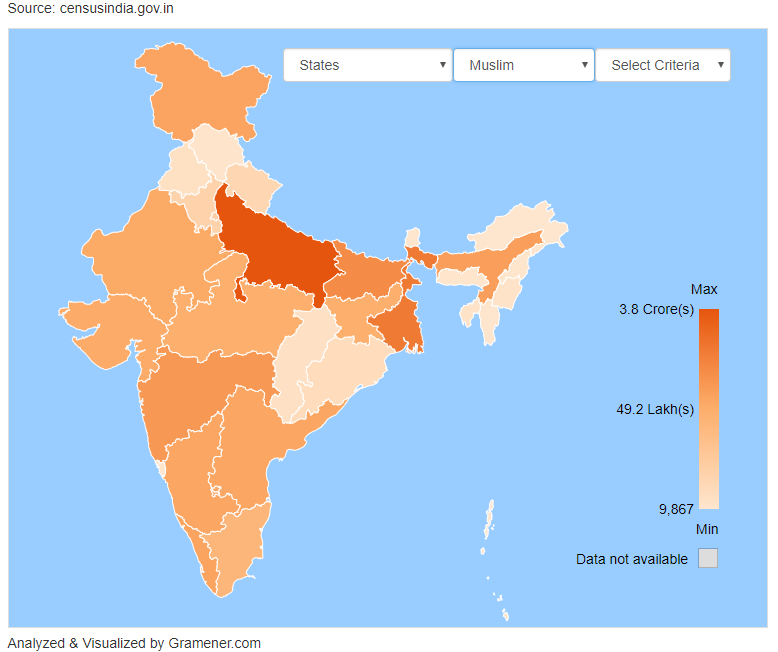
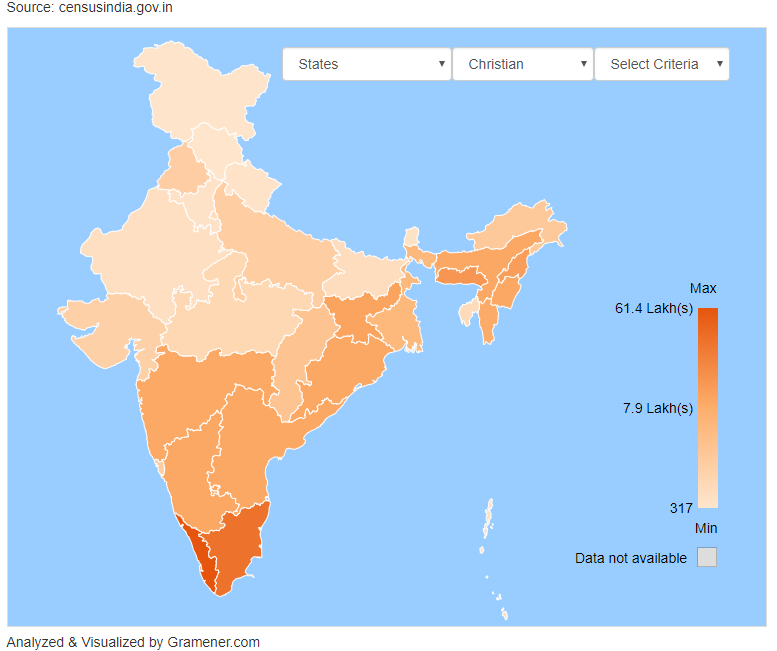
But what happens when we start filtering the map with respect religions spread across the country.
First, the Hindu. Uttar Pradesh seems to be the residence of most Hindus. Why? We’ll tell that in the end.
Then, Muslim. Well, Again Uttar Pradesh. Interesting?
Followed by Christian. Here, Northern India is less likely a home to Christians when compared to the south. This could be because Calicut and other southern coastal areas were a common passage for Portuguese, French and English traders to enter in India.
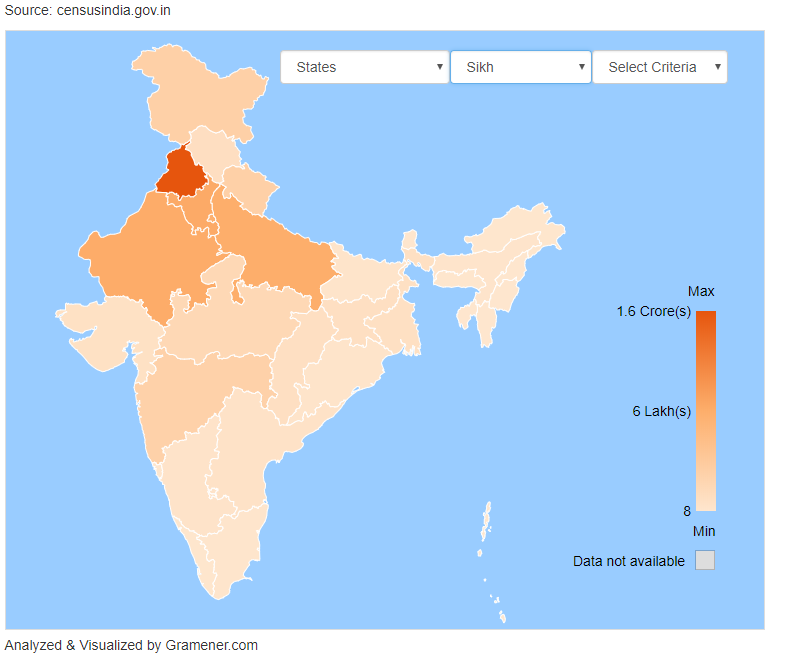
And, Sikhs. The highest involvement is in Punjab and Sikh dominant region.
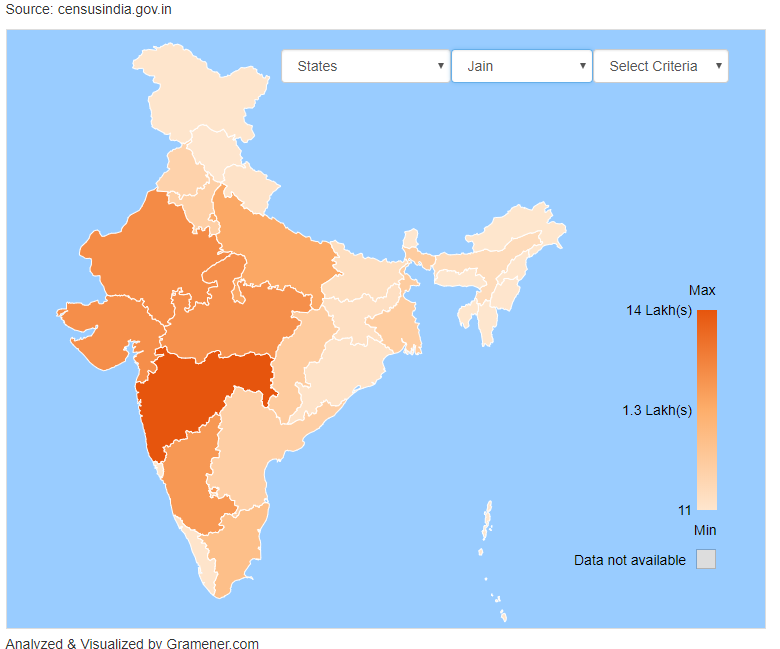
And finally, Jain. Maharashtra holds the highest number of Jains in India. As per the 2011 census, there are only 4,451,753 Jains in the 1.21 billion population of India, with the majority residing in Maharashtra. The numbers have certainly increased now but in the same state.
Could you find a story in it?
If you notice, the most populated state – Uttar Pradesh, has the maximum number of Hindu population as well as the Muslim population. This could be due to the ancient existence of Hindu deities such as Ram and the medieval existence of Mughals and other Muslim rulers, respectively. On the negative side, this also might be the reason for Uttar Pradesh being a state with most registered cases of communal violence.
Maharashtra holds an abundant Jain population because they have had a rich history of Jain rulers such as the Rashtrakuta dynasty or the Shilaharas from the medieval period.
Similarly, we explained why Kerala and other southern parts of India is home to many Christians.
See, it was simple. We told you a story about the religious population in India and divided the data-driven rationales into many parts. Now, you would remember it.
A good storytelling with data from BI tools can produce many such interesting and thought-provoking insights.
DIY with Gramener’s Religious Group Visualization and tell us the story you could deduce from it.
Also, for starters, you can enter any data in Gramener’s free online India Map excel application and drive your skills in storytelling with data.