
This is part 2 of a 4-part series on The Making of Manhattan’s Coffee Kings. Read Part 1.
By this time, we had the shapefiles for Manhattan (by census tract), the population of each tract, and the location (in Sheet1) of coffee shops around Manhattan. The next step was to create the “coffee map” of Manhattan.
Merge population data into map
To merge the population data into the shapefile, I used geopandas — a slightly-complicated-but-better-than-alternatives Python library to work with Shapefiles. The code is here. What we did was:
- Load the population Excel file (code)
- Load the shapefile (code)
- Filter both for Manhattan as the borough (code)
- Merge the two using the CT2010 (Census Tract 2010 code) field (code)
Normally, this would have sufficed. But after several minutes of debugging, I found two other issues with the shapefile.
- The population was stored as a string, not an integer. (fix)
- The projection didn’t use latitude-longitudes. (fix)
If you didn’t understand the projections bit, don’t worry. I don’t get it either. But if I find that my shapes are in the wrong place, I usually spend 10-20 minutes of trial and error on the projection, and something usually works.
Filter coffee shops within Manhattan
I used geopandas again to take all the stores and check if they were within the Manhattan shape boundary. The result is a 288-row CSV file with the latitude, longitude, address and store name (Starbucks or McDonald’s).
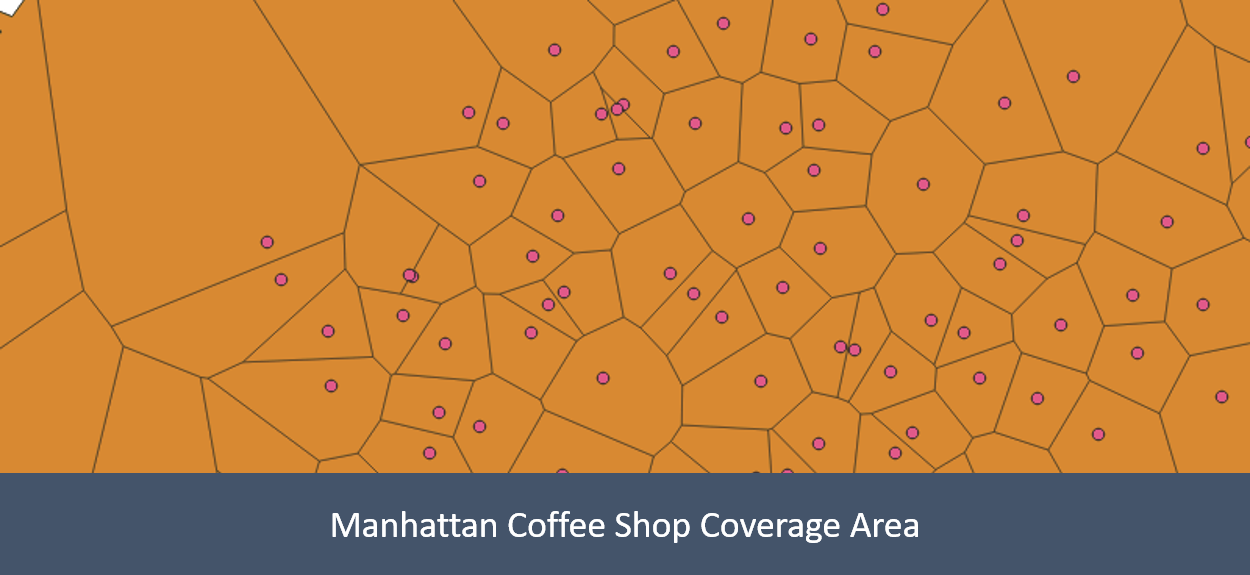
Create the coverage area map
Running the script manhattan.py creates 3 maps:
single.shpwith Manhattan’s boundary as a single regionpoints.shpwith the coordinates of individual storespopulation.shpwith the census tract and population
To create the coverage area, I used QGIS’ Voronoi Polygons. This splits Manhattan into regions that are nearest to each store.

I followed these steps.
- Open QGIS and load all 3 maps as layers
- Layer > Add layer > Add vector layer
- Select each .shp file under map/, and “Add”
- Create a Voronoi polygon layer
- Vector > Geometry Tools > Voronoi Polygons
- Input layer:
points - Buffer region (% of extent): 50% (to go well beyond Manhattan’s area)
- This creates a layer called “Voronoi polygons”
- Intersect this layer with Manhattan
- Vector > Geoprocessing Tools > Intersection
- Input layer:
single - Overlay layer: Voronoi polygons
- This creates a layer called “Intersection”
- Save the “Intersection” layer as
voronoi-stores.shp

voronoi-stores.shp is a shapefile that has the coverage area of each store.
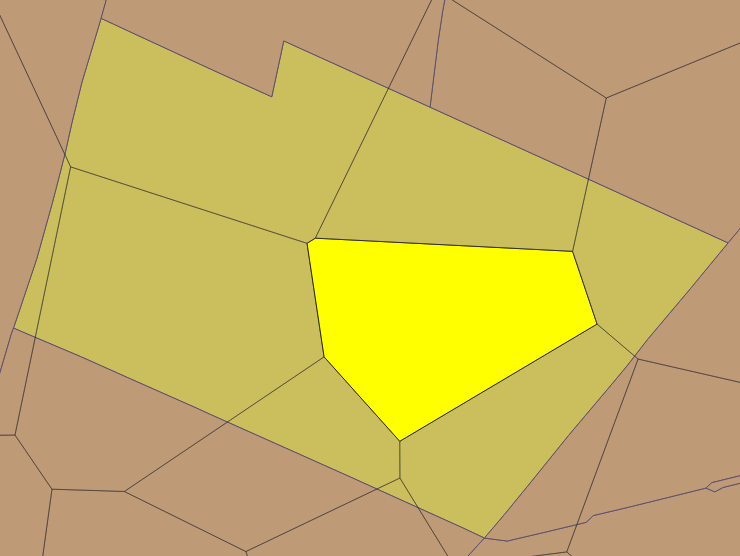
Merge population data into the coverage map
A naive but effective way of finding the population of any region is to assume that the population is uniformly distributed.
For example, the Starbucks at 120 Church Street is entirely within the census tract CT 002100 in Little Italy and covers 18.5% of its area. So we can assume that this Starbucks serves 18.5% of the 6,040 people in the tract, i.e. 1,120 people.
I wrote a utility merge.py to automate this calculation. By running this command:
python reshaper/merge.py voronoi-stores.shp population.shp \
    manhattan-stores.shp -m Pop2010
… I was able to merge the census population data into the coverage area map.