

Power BI is a great tool in creating insightful data stories on dashboards. But did you ever imagine a Power BI dashboard conveying a data story with emotional comics? Sounds interesting! Doesn’t it? In this blog, we are going to learn how to create a simple comic data stories in Power BI dashboard using Comicgen Power BI plugin.
Gramener offers a wide range of Power BI Services for businesses, which also includes workshops and training to create dashboards in Power BI.
What is the Comicgen Plugin?
Comicgen is a comic creation tool that we developed to help data enthusiasts create comic data stories.
Recently, we created a Comicgen plugin for Microsoft Appsource. This plugin integrates with Power BI and adds comic characters. The emotions, poses, angles, and dialogues of the comic characters can be driven by data in Power BI.
We can set ‘Emotions’ or/and ‘Poses’ to static or ‘Data-Driven’ in Comic settings. We can also choose different Comic characters. Currently, the plugin supports two characters, ‘Dee’ and ‘Dey’. We are working on adding more characters.
The list of emotions includes normal, laugh, sad, wink, angry, worried, surprised.
The list of poses include pointing right, pointing up, yuhoo, superperfect, holding a laptop, angry frustrated, hands folded, hardship, holding a book, reading paper, thumbs up, and thinking.
You can check out more emotions and postures at our official Comicgen page. Now, with these resources in hand, it’s super easy to create comic books in Power BI.
Steps to Create Comic Data Stories in Power BI
Before going to the steps, we highly recommend going through this video guide that will make the installation easy for you. This video guide is created by Power Platform Specialist and YouTuber Dhruvin Shah.
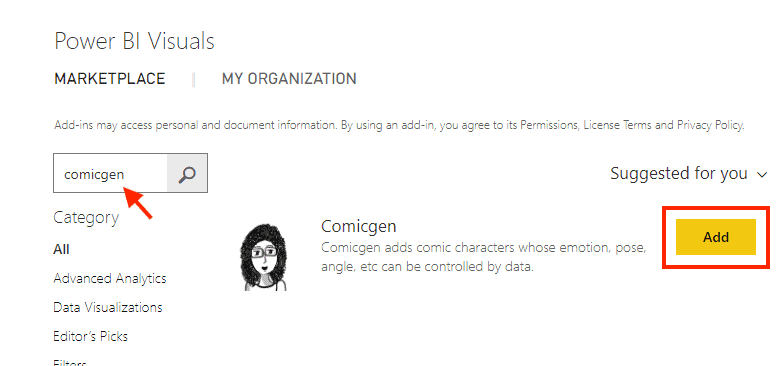
Step-1
Import ‘Comicgen’ custom visual from Microsoft market place into your Power BI desktop file.
Step-2
Create DAX measures in Power BI for ‘Pose’ and ‘Emotion’ as required.
For example,
QoQ_Sales_Pose = IF(CALCULATE(SUM([Sales])) > 10000,
"superperfect", "angryfrustated")
GrossMargin_Emotion = IF(CALCULATE(SUM([GrossMargin])) > 70,
"laugh", "sad")Step-3
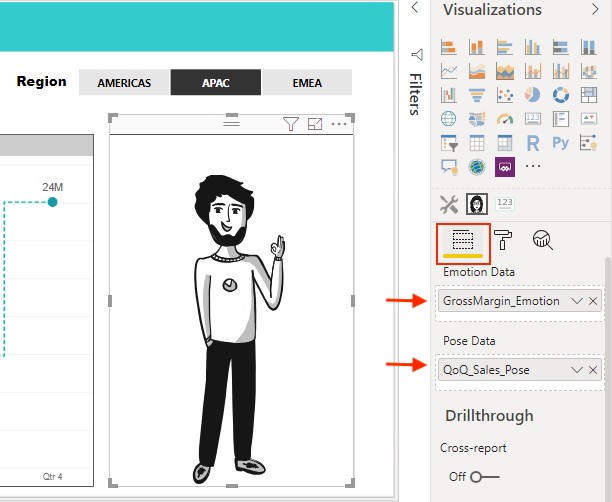
Drag and drop the created measures into respective data fields of the Comicgen visual as shown below.
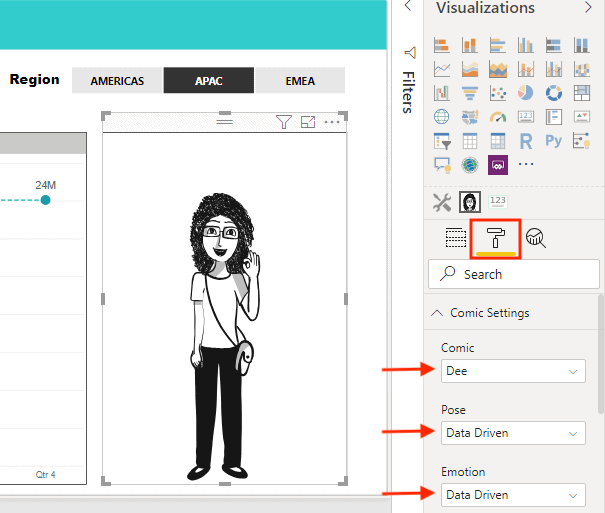
Step-4
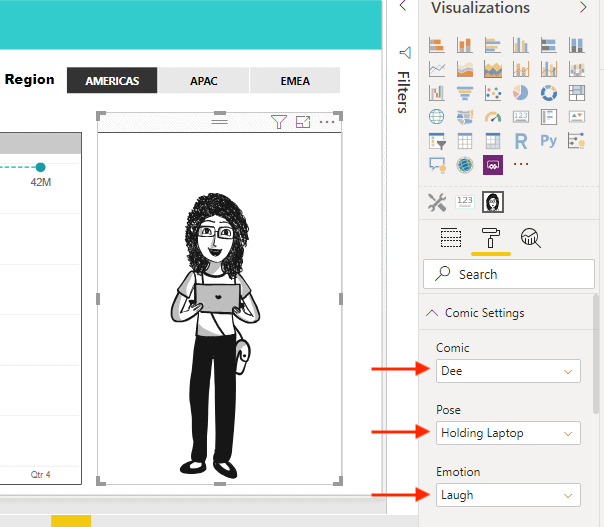
Go to Comic settings in the format section and select your preferred ‘Comic’ from the dropdown. Then set ‘Pose’ and ‘Emotion’ as ‘Data-Driven’ from the dropdown as shown below.
Step-5: (Optional)
If you want the comic to be static then select the required emotion and pose from the dropdown list in the comic settings as shown below.
Use Cases of Comicgen in Power BI
Well, Comics with emotions convey the insights in a better way and make the stories easier to consume. Emotional data stories are more engaging and understood quickly. Below are a few uses that we created in Power BI using Comicgen.
- In the below use case, ‘Dee’ (on left) reacts to Sales performance and ‘Dey’ (on right) reacts to Business Unit performance between the last two quarters on the visual chart.
- In the below use case, ‘Dee’ reacts to ‘Average life span’ (in years) of various countries as the year changes on the play axis.
Comics are pretty cool to use in Power BI storytelling, aren’t they? Let us know your thoughts in the comments section.
Liked it? Try creating your own examples on Power BI using Comicgen and share them with us. We look forward to it! Have fun!
You can also register for our data storytelling workshop where our experts teach techniques and formats of data storytelling. The workshop is for analysts and data scientists or any business user who want to convey insights as data stories.
Hi team,
Excellent idea! Thank you so much for the post. Quick doubt: Can we add our own characters to the back end?
Regards,
Tushar Sadhu
Thanks for your comment Tushar Sadhu. We are glad that you liked the idea.
‘Adding characters of user’s choice to the back end’ is on our to-do list. We will keep you posted on this.
Regards,
Navya
This is awesome 👍.
This post was really helpful for me as I was searching for an article related to Power BI. Thanks and keep sharing such articles.