
Here are three links you should go through this week.
- What I learned recreating one chart using 24 tools is an excellent comparison by Lisa of 12 visualisation applications and 12 libraries, with a good summary of which tool to use when.

- Can we predict flu deaths with ML and R? Read this R notebook for a step-by-step walk-through of predicting whether a patient will survive or not. (There’s also a part 2 that improves on this model.)
- One of our colleagues nearly lost a piece of analysis recently. Here’s the most boring / valuable advice she can get on how to organise analysis — or any form of work for that matter. Of course, you could always learn git.
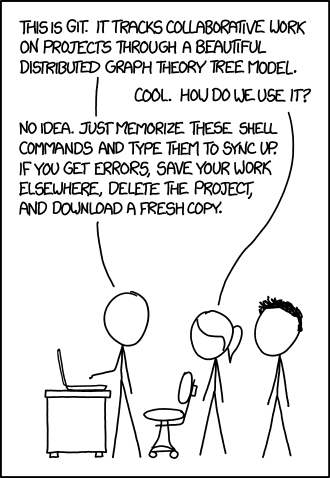
If that doesn’t fix it, git.txt contains the phone number of a friend of mine who understands git. Just wait through a few minutes of ‘It’s really pretty simple, just think of branches as…’ and eventually you’ll learn the commands that will fix everything.