
Sometimes, timing is everything in investments.
Last year, The New York Times published a piece titled In Investing, It’s When You Start And When You Finish. This showed the significant impact of timing in investment decisions.
At Gramener, we applied the same visualisation to a few Indian stocks over the last 5 years.
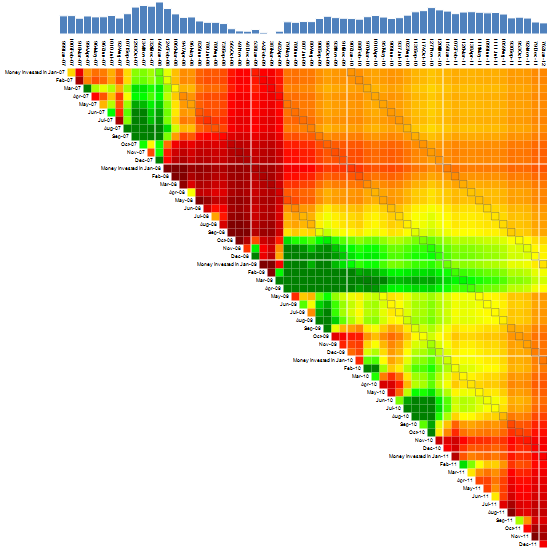
Here’s what it looks like for ICICI’s stock.
If you invested in ICICI stock in Jan 2007, the first row of boxes show the kind of returns you would have seen.

The colours indicate the degree of profit or loss. Red for losses, green for profits, and yellow for neutral values. Selling in March 2007 would have made significant losses. Selling in Jan 2008, one year later, would have given you a good profit. And so on.
The same is extended to investments made in other months.
")
The black boxes show a holding pattern of 1 year, 2 years, etc. You can get a sense of what kind of returns you would make with a strategy of holding for 1 year, 2 years, and so on.
Here are similar pictures for Infosys stock and SBI stock.


At Gramener, we took a look at a number of such stocks and their performance over the last five years. A interactive app showcasing sample of those is available at http://gramener.com/whentoinvest/.