

Put another way, it’s the income tax collected from 10 lakh Sehwags or Dhonis, 1,600 Van Gogh portraits, or just 100 residences like Antilia, Mumbai.
We decided to take a closer look at the budget to see how this money was being spent, and how this has changed over the last 10 years, based on data from the Union Budget.
Here’s a short video giving an overview of the budget and some observations.
Let’s take a closer look:
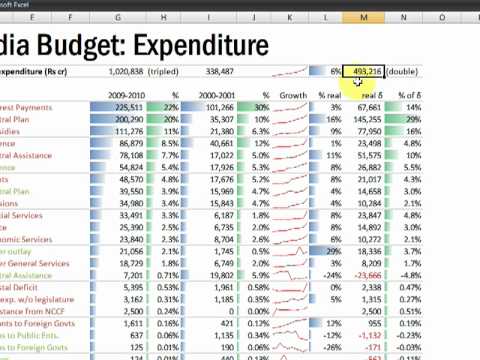
The budget has tripled over the last 10 years in nominal terms, from 338 thousand crores to 1,020 thousand crores. But if you adjust for inflation (using WPI), it’s doubled In 2010 terms, the budget in 2000-2001 was Rs 493 thousand crores. That’s a 6% growth in real terms (12% nominal) — about in line with the GDP growth. The graph also shows acceleration. The growth over the last 4 years was 12% in real terms — twice that over the last 10 years.
The top expense, interest payments, is over a fifth of the budget. It has more than doubled in nominal terms over the last 10 years. But in real terms, that’s not too big — just a 3% growth. The bulk of this growth has happened in the last 4 years. Interest payments only accounts for 14% of the real increase in the budget.
The Central Plan has a different story, however. It’s grown to the second largest item, but 10 years ago, it was just 10%. It has experienced the fastest growth: 16% in real terms. In terms of contribution to the real budget increase, this is the single largest contributor, at 29%.
Subsidies have grown considerably as well, though not as much as the Central plan. They contribute 16% — about as much as interest payments — to the real budget increase, but what’s interesting is the surprisingly large growth in recent times.

A pattern that is emerging is the recent growth in expenditure. Many items have had a substantial increase in the recent past. Defence revenue expenditure, pensions, police, social services, etc. have had a marked increase in the last year. Many others, like interest payments, subsidies and central assistance have grown considerably over the last few years. This may be a pattern worth investigating further.