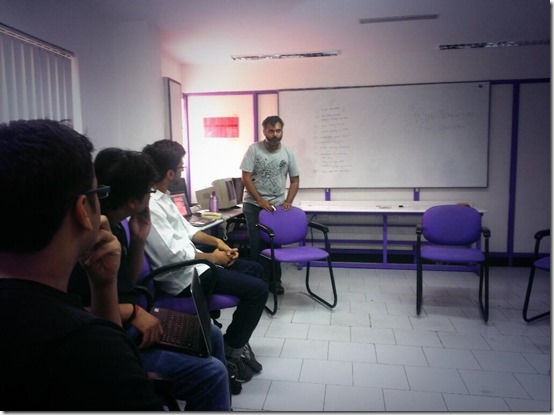
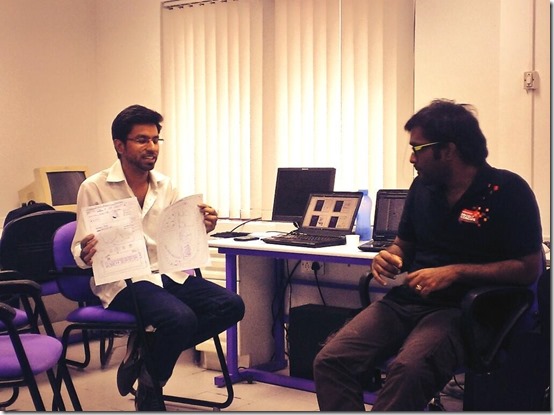
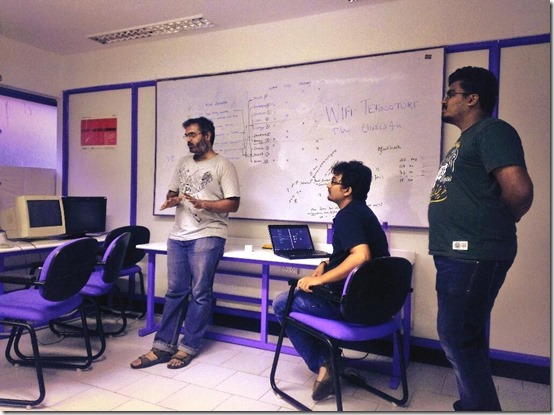
Ten people converged at Gramener’s Bangalore office to scrape, analyse and visualise football world cup data.
The objectives were two-fold: to create something useful (no matter how small) in any shape or form; and to learn from the process.
We began at 12:00noon…
… did a quick checkpoint at 4:15pm to see where we were…
(Photos courtesy Rasagy Sharma).
Updates were provided on the #fwchack (Football World Cup Hackathon) hashtag. Here’s a summary of what we’ve managed to come up with:
- A dataset with match results and goal timings for every final stage match since 1930
- A visualisation of football world cup appearances by country from 1930 – 2014
- Tournament by tournament data of fouls by players in CSV, JSON and YAML
- A visualisation on how nations have performed in the FIFA World Cup
- Sketches for a social media dashboard and a world cup statistics dashboard
- A countdown for the FIFA world cup with facts
The list is incomplete. We’ll hopefully be adding in a few more items shortly – including a live Twitter analyser and a visualisation of the fouls data.
This hackathon was just to get the momentum rolling. Now that at least some of the data and design ideas are out, hopefully we’ll see many more data visualisations in this space.


