
By Sundeep Reddy Mallu, Ganji Kiran, Rithul Krishnan & Ankita Dash
You are a data science company, and in the age of AI, what’s your prediction for the Karnataka Assembly election outcome? This is a constant question that we get from our customers and audience during the election season. Gramener, over the years, has worked with various media houses to assist in Election outcome analysis and Visual Storytelling. Due to this association, we are asked to answer the above question repeatedly. The analogy given is how pollsters and psephologists in the USA can predict election outcome with great accuracy.

Through this article, we will explain our view of why the Indian Political system is different from that of the USA and talk about data gaps in India that make it a harder Data Science problem to solve.
Political System
- Voter choices – USA is a dominant Bi-party system – Republican & Democrats, the third Libertarian Party is rarely heard. Contrast this with 2044 registered parties in India. (Source – Election Commission of India – link). This increases the no.of combinational factors from a variable selection standpoint. Due to the large no.of parties contesting their vote share doesn’t translate into the number of seats/wins. Case in point 2008 Karnataka state elections, the winning party, BJP, got 33.86 per cent votes while the runner-up Congress won 34.76 per cent votes, 0.9% more than the winner.
- Voter Party Identification – In the USA predicting party identification is reasonably established based on past voting trends, declaration of party affiliation during registration, gauging current public opinion on different current events and a strong local polls. Such a vast and rich quality of reliable data allows pollsters to predict Republican and Democratic-leaning districts within an acceptable margin of error. (Note: 2016 USA Presidential election was decided in favor of Mr. Donald Trump due to 80,000+ votes which fell within the margin of error for most models. Though story line emanating is that most pollsters got the election outcome wrong). In India party identification is a complex undertaking. The no.of choices a voter has is large and able to predict which party they will vote becomes tough.
What drives Voter decision in India?
The following set of competing constraints influence the voter behavior. No single constraint can be taken up as a reliable indicator for voting decision. There is no reliable data tied to each factor that can be fed into a model to predict an election outcome.
Community/ Caste/ Religious Identity – The largest democracy in the world is notorious for its Caste/ Community/ Religious politics. The caste/ ethnicity of the candidate contesting plays a key role in garnering votes. Political parties undertake a massive vote distribution formula to give tickets to prospects while giving their tickets. There is no reliable figure that gives the distribution of eligible voters or population by Community/Caste/ Religion in India. There have been attempts like Socio-Economic and Caste Census (SECC) that was last done in 2011. India is witnessing a religion based polarization of voters. This is evident in Religious entities actively advising their followers on who to vote. E.g. A Yadav or Dalit community member has a higher potential to vote for a party that would advocate for community needs.
Income Group / Economic Well/ Education – Post-1991 economic liberalisation has created a burgeoning middle class with a varied set of aspirations. The family income of a voter forces them to pick a different party depending on the location they reside. Economic desires counter to the conventional approach to the voting decision. The level of education attained by a voter greatly influences their expectation from the candidate they would vote. Regions with lower education levels mostly have agriculture-based economy, while regions which have higher education levels are hubs for service sector and manufacturing. Education qualification has a strong influence on the income group and social well being.
Age of Voters
The no.of first time voters has rapidly tilted the scales in the last two decades. The aspirations/ needs/ wants of this age group is forcing political parties to have a different messaging. Such messaging alienates older voters forcing them to look for parties that are more sympathetic to their needs.
Gender of Voters
Traditionally all votes in a household were cast for the same party. The decision on whom to vote was made by the Head of House, a male. Each political party honed their message to a single gender. For the last two decades, women entering the workforce in large numbers and rapid urbanisation has seen a shift in how men and women vote. Political parties have accepted this change and now cater to each gender with different schemes/ programs/ messaging.
Candidate Image
The perception of candidate’s Image contesting the polls has a strong influence in voting decision. Corruption and Scams tied to a candidate/ party can swing outcomes to a large extent. This is more prominent in Urban areas than in rural areas. Past few elections have witnessed a personality contest between two major parties at the national level. This personality contest plays out at individual constituency level to some extent. Quantifying the image of candidate is beyond a simple number assignment.
Urban vs Rural Voter
Rapid urbanisation in the last two decades has resulted in redrawing of constituent level maps. The aspirations and needs of voters in Urban and rural areas have commonalities, to some extent, but also vary significantly once economic and socio-political factors are considered. Assigning the right weight to location of residence to a model is tricky.
Money of Votes
Though Election Commision of India (ECI) is responsible to ensure the candidates spend a designated amount of money for their election campaigning, its an open secret that votes are bought during election. The party that spends the most has a good shot at winning a particular constituency. Voters,who are on lower end of socio-economic ladder, look at this as an opportunity to earn money during an election. Given that exchange of money for a vote is Illegal per Indian law, there is no reliable data that can be part of a prediction model.
Karnataka Snapshot
Constituency breakup
The state can be broadly clubbed into these clusters, each having its unique distinguishable socio-political, Education/ economic and community/caste/ Religious factors. Every political party has to approach each of these regions with a different message and intent. To reach the halfway mark of 112 a party has to do well across at least 3 regions.
- Hyderabad Karnataka, the portion which shares its boundary with Andhra Pradesh & Telangana.(40 seats). Large proportion of minority population
- Mumbai Karnataka, the portion which shares its boundary with Maharashtra (50 seats). Strong presence of Lingayat community. This community accounts for 17% of state population
- Coastal Karnataka (19 seats). Highly polarised region, BJP and Congress are highly mobilised
- Mysore/South Karnataka (65 seats). JS(S) strong hold
- Central Karnataka (22 seats). This is the swing region in the state
- Bangalore city (28 seats). BJP has made inroads in this cluster, used to be a traditional Congress territory
Past Election trends (Courtesy Kiran Ganji & Rithul Krishnan)
- Congress has won the Karnataka Assembly election 5 out of the last 9 elections, which gives it a pole position.
- The proportion of female elected representatives to population is quite low in Karnataka assembly. In the 2008 elections 3 out of 224 and 6 out of 224 in 2013 were female representatives.
- Less than 10% of constituencies witnessed close races. 19 in 2008 and 18 in 2013. A difference of less than 1% votes between winning and second candidate is a close race.
- 95 sitting MLAs were reelected in the 2013 cycle. This translates to less than 50% of reelection.
Is there a Proxy metric we can look at for election outcome?
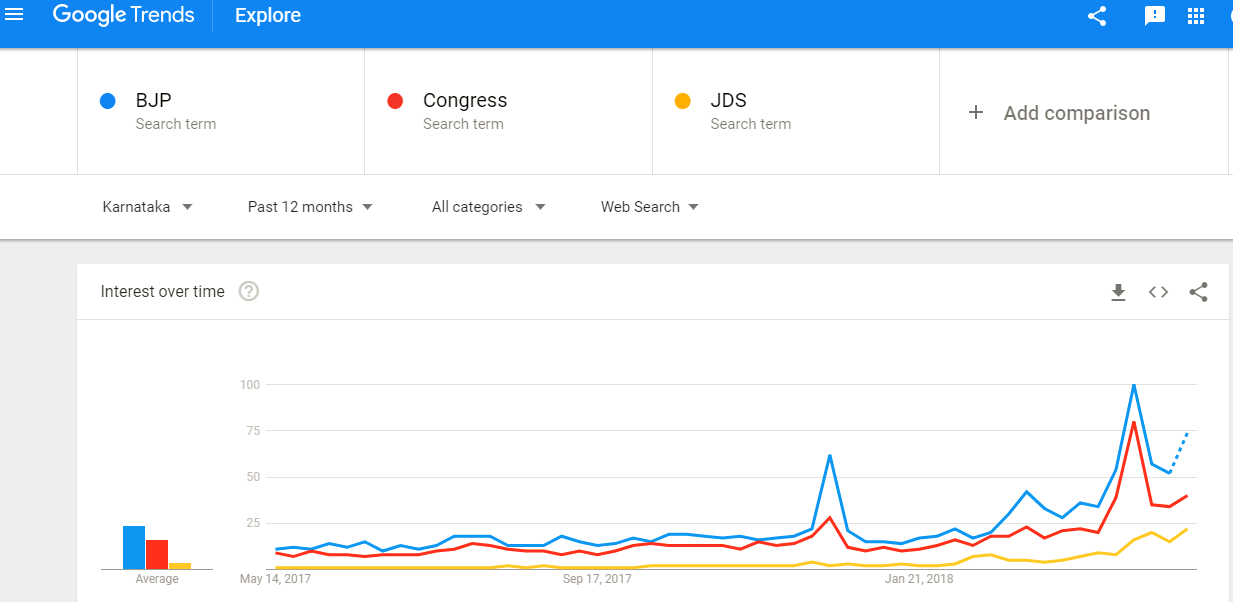
Can we look at a proxy metrics that can help us predict election outcome? The answer is a BIG MAYBE. Google Trends for searches done on the Web in a particular geographical region. Rahul Gupta summarized his analysis in an article titled “Why Google May Be the New, Better Way to Predict Election Results“. The premise of his article and the proof from Google Trends that he relies on shows that whoever leads in the Google search trends during the election year has a strong chance of winning the election.
We decided to put this hypothesis to test for Karnataka state election. Below is the Google trends screenshot for searches done across Google services for Congress, BJP and JDS in the last 12 months leading to election day. The search trends give BJP an edge by accepting the premise explained by Rahul Gupta in the above article.
Current Karnataka CM Mr. Siddaramaiah has made a name for himself with this straight talk and shrewd political moves, we put his popularity to test against potential CM candidates from BJP and JD(S). The below Google Search trends indicate that Mr. Siddaramaiah is outperforming projected CM candidates from rival parties consistently for past year.
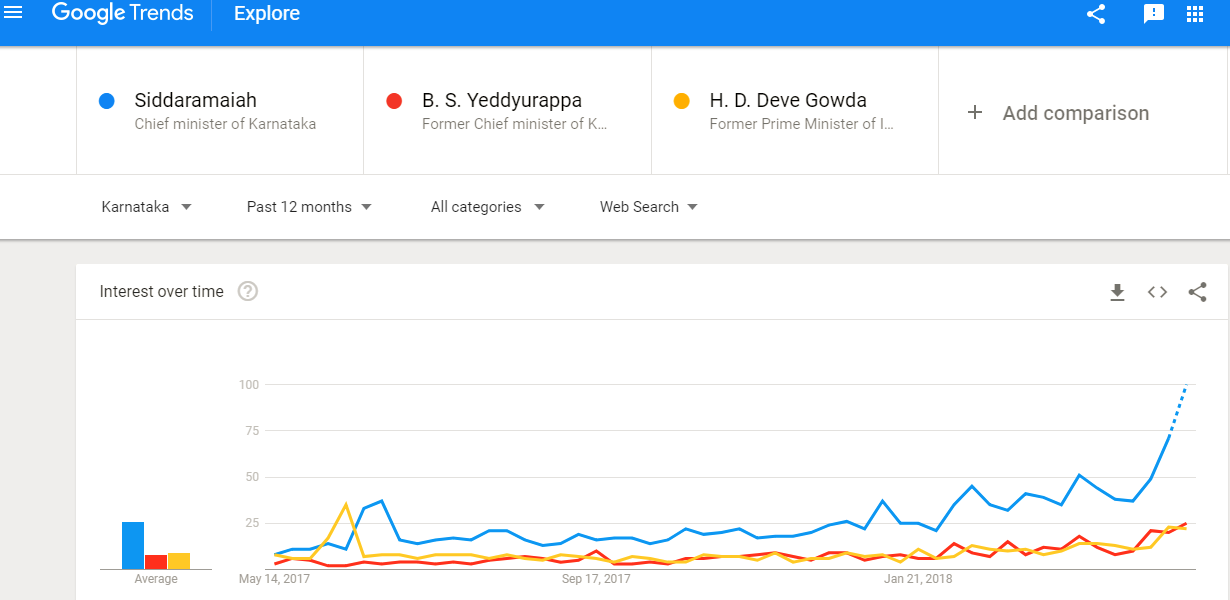
Picture Credit: Google Trends data ahead of the Karnataka elections. If the above Google trend results in Congress retaining power and continue with Mr. Siddaramaiah, he will be the first CM who would get a second term after completing a full 5-year term.
Over to 15th May for the actual results. We hope with increased mobile penetration and a greater focus on collecting tangible data about voter perceptions and intent at some point in the near future we can build an AI model that can predict election outcomes in India.
Data Source: