ISB’s SRITNE (Srini Raju Centre for IT and the Networked Economy) is a research canter that focuses on the business and societal value of IT. Gramener collaborates with SRITNE to develop and promote visual analytics, and to help foster a culture of open data within the community.
As part of this collaboration, we jointly presented ‘Visualisation of Migration Patterns in India’ at the Bangalore Open Data Camp. Access to the source dataset for this analysis was provided by ISB and Visualisations were done primarily on the Gramener Visualisation Server. MS Excel and R were used for exploratory analysis. The aim of this exercise was to take an outside, analytics view of the Migration Patterns to explore alternate possibilities of representation and visualisation, rather than from the lens of a Demographics Analysis Expert.
The Indian NSSO (National Sample Survey Office) had conducted the 64th round survey on ‘Employment & Unemployment and Migration Particulars’during July ’07 to June ’08 covering 1,25,578 households and 5,72,254 persons.
Of this sample, ~30% were found to be migrants, i.e. those whose last usual place of residence (UPR) was different from the present place of enumeration. In this survey, the usual place of residence of a person was defined as a village/town where the person had stayed continuously for six months or more. Amongst the migrants, a majority were found to be moving within the state (85%) as opposed to those moving across states (15%). Women formed a sizeable majority of this migrant population.
Intra-state migration patterns
The map on the left has the intra-state migration pattern (excluding inter-state numbers) showing the absolute number of migrants moving within each state/UT. Green indicates higher migration and red is the opposite. Based on this map, the 5 most populous states in India account for the top 5 intra-state movements, except for Bihar which comes a close 6th. If we rescale the numbers by taking migrants as a percent of the state/UT’s survey size, as shown in the right map, the results change completely. The top 5 states with highest percent churn are Andhra Pradesh, Himachal Pradesh, Kerala, Gujarat and Andaman & Nicobar Islands.
Inter-state migration patterns
If we now look at the Inter-state migration pattern (excluding within-state movements) by plotting the Net Inflow of migrants into each state/UT (left-hand-side map), the states with highest net outflow of migrants are Uttar Pradesh and Bihar, while those with highest net inflow are Maharashtra and Delhi. If we rescale the numbers, as a percent of the state/UT’s survey sample, the story changes, yet again. All the Union Territories in India have the highest Net percent Inflow, with Chandigarh showing the highest value at 41%.
Inter-state migration Heat-map
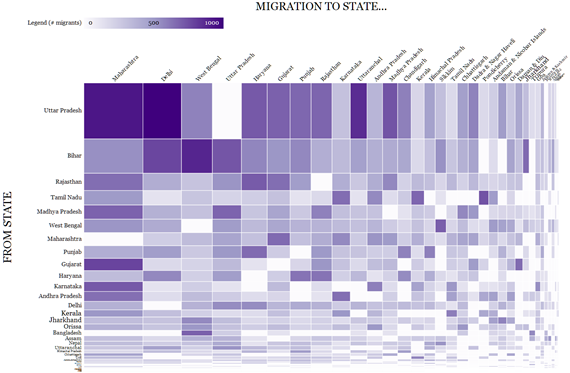
In order to get a sense of exchange of migrants happening between the states, we plotted the numbers on a heat-map. The y-axis of the heatmap has ‘From-State’ while ‘To-State’ is on the x-axis. The height of each heat-map box is proportional to the net outflow from the contributor-state, while the width of each box is proportional to the net inflow into the recipient-state. The colour is representative of the number of people moving between the states – darker the box, more the number of people.
As can be seen, the top destinations for people leaving UP are Delhi, Maharashtra and Uttaranchal respectively. For Bihar and Rajasthan, the top destinations are highlighted accordingly. What is more interesting is the pattern of top destinations for each of the states. A clear trend is the consistent preference of people across regions to migrate into states with geographical proximity. The survey had also covered a set of international in-migrants, wherein Bangladesh the top contributing country has a sizeable proportion of its migrants moving to West Bengal.
Migration across Rural-Urban areas
When migration was viewed from the perspective of movement across Rural – Urban areas, a surprising trend found was the extent movement within Rural Areas – more than half of migration in India happens amongst the Rural regions. About 40% of migration is towards Urban areas. A contra-trend noticed here was for the Union Territories and North-Eastern States – over 70% of migration in these areas is towards the Urban regions, unlike the rest of India.
Reasons for migration
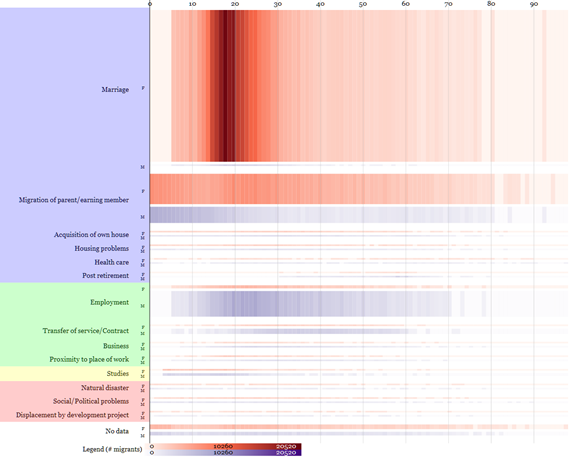
When an analysis of Reasons for Migration was done at the Country level, some key trends were observed. Women, who form a sizeable majority of the migrants primarily migrate on account of ‘Marriage’ and their typical age at marriage is between 15 and 24. For men, the key reason for migration is ‘Employment-related’ and this primarily happens in the age band of 18 to 40. Consequently, migration due to ‘Movement of Parent/Earning member’ forms another key reason. ‘Education’ is also found to be a driver of migration and this typically happens for men and women until the age of around 23 years.
When we looked at the Reasons for Migration vis-à-vis States, a few interesting patterns showed up. People in Tripura migrate mostly due to Forced Reasons/Disasters, whereas UP witnesses Marriage-related movement. Kerala and West Bengal witness migration because of Housing related reasons, whereas a lot of people in the scenic state of Himachal Pradesh migrate for post-retirement life.
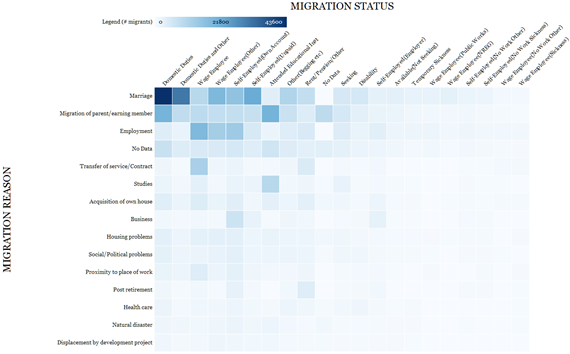
It is evident from the above heatmap that a majority of the women who migrate for marriage, end up doing Domestic duties, while men who move for employment end up as Wage employees/labourers.
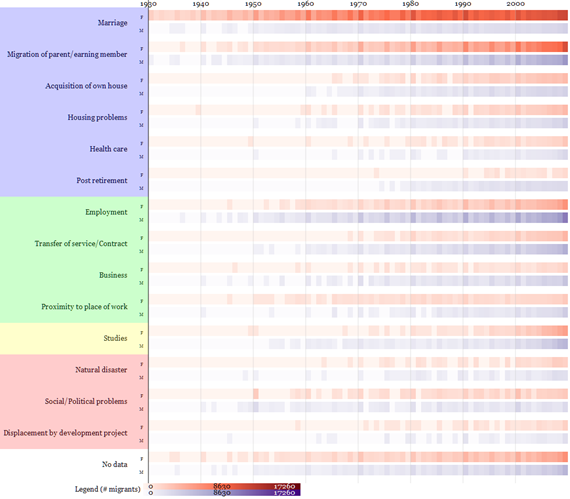
The survey sample had a good mix of people who had migrated over the years, dating as far back as the 1930s. When we analysed the pattern of evolution of migration reasons, interesting trends emerged. Until Independence, migration was subdued and was restricted only to the women getting married. Post-independence, migration numbers have steadily increased over the next 60 years. After 1970s, increasingly more people started moving for Employment-related reasons. This was also accompanied with migration of the dependent families. It has been only after the 1990s that people move in significantly larger numbers and for reasons such as Business, Education, Housing, Post-retirement, Healthcare – more inline with the Indian Economic Development story over the past 60 years!


It is good. Since I am working on migration that too, inter-state migration, this is highly useful for me. Do you mind if I refer your name in my report? I also found that women migration changes after 70s from Kerala. By 70s educational level of women have increased, and opportunities inside Kerala are rare. Also due to high wage rates, Bengalis, Biharis and Maharashtrians have entered Kerala for employment. Also there is a real estate boom……. Thank you.
Hey, can you please tell me which platform you used to create “Inter-state migration Heat-map”. I need to create something similar in Power BI. Any inputs would be of great help. Thanks.