
Gramener organised a design workshop at the National Institute of Design (NID), Bangalore a few weeks back. The one-day session was organised for the 2nd year students of Master of Design (M. Des.) course specialising in ‘Information Design’. The workshop was on “Visual data representation & design of effective Business Dashboards”. This was handled by Ganes Kesari B, Head of Design & Analytics at Gramener.
The session introduced the fundamentals of data visualisation by presenting a framework for visual consumption of data. The effective modes of information design were reviewed by understanding principles of human cognition and how humans process information. The module on data analysis familiarised the participants with basic techniques of exploratory data analysis and extraction of unusual, interesting insights.
Visualisation was studied by breaking it down into the constituent elements and looking at the basic list of visual encodings like position, color, shape, angle etc. Other important concepts covered included the grammar of graphics, fundamentals of information presentation, and principles of building visualization dashboards. The concepts were covered by distilling the learnings from stalwarts in the field like Edward Tufte, Stephen Few and Ben Schneiderman amongst others.
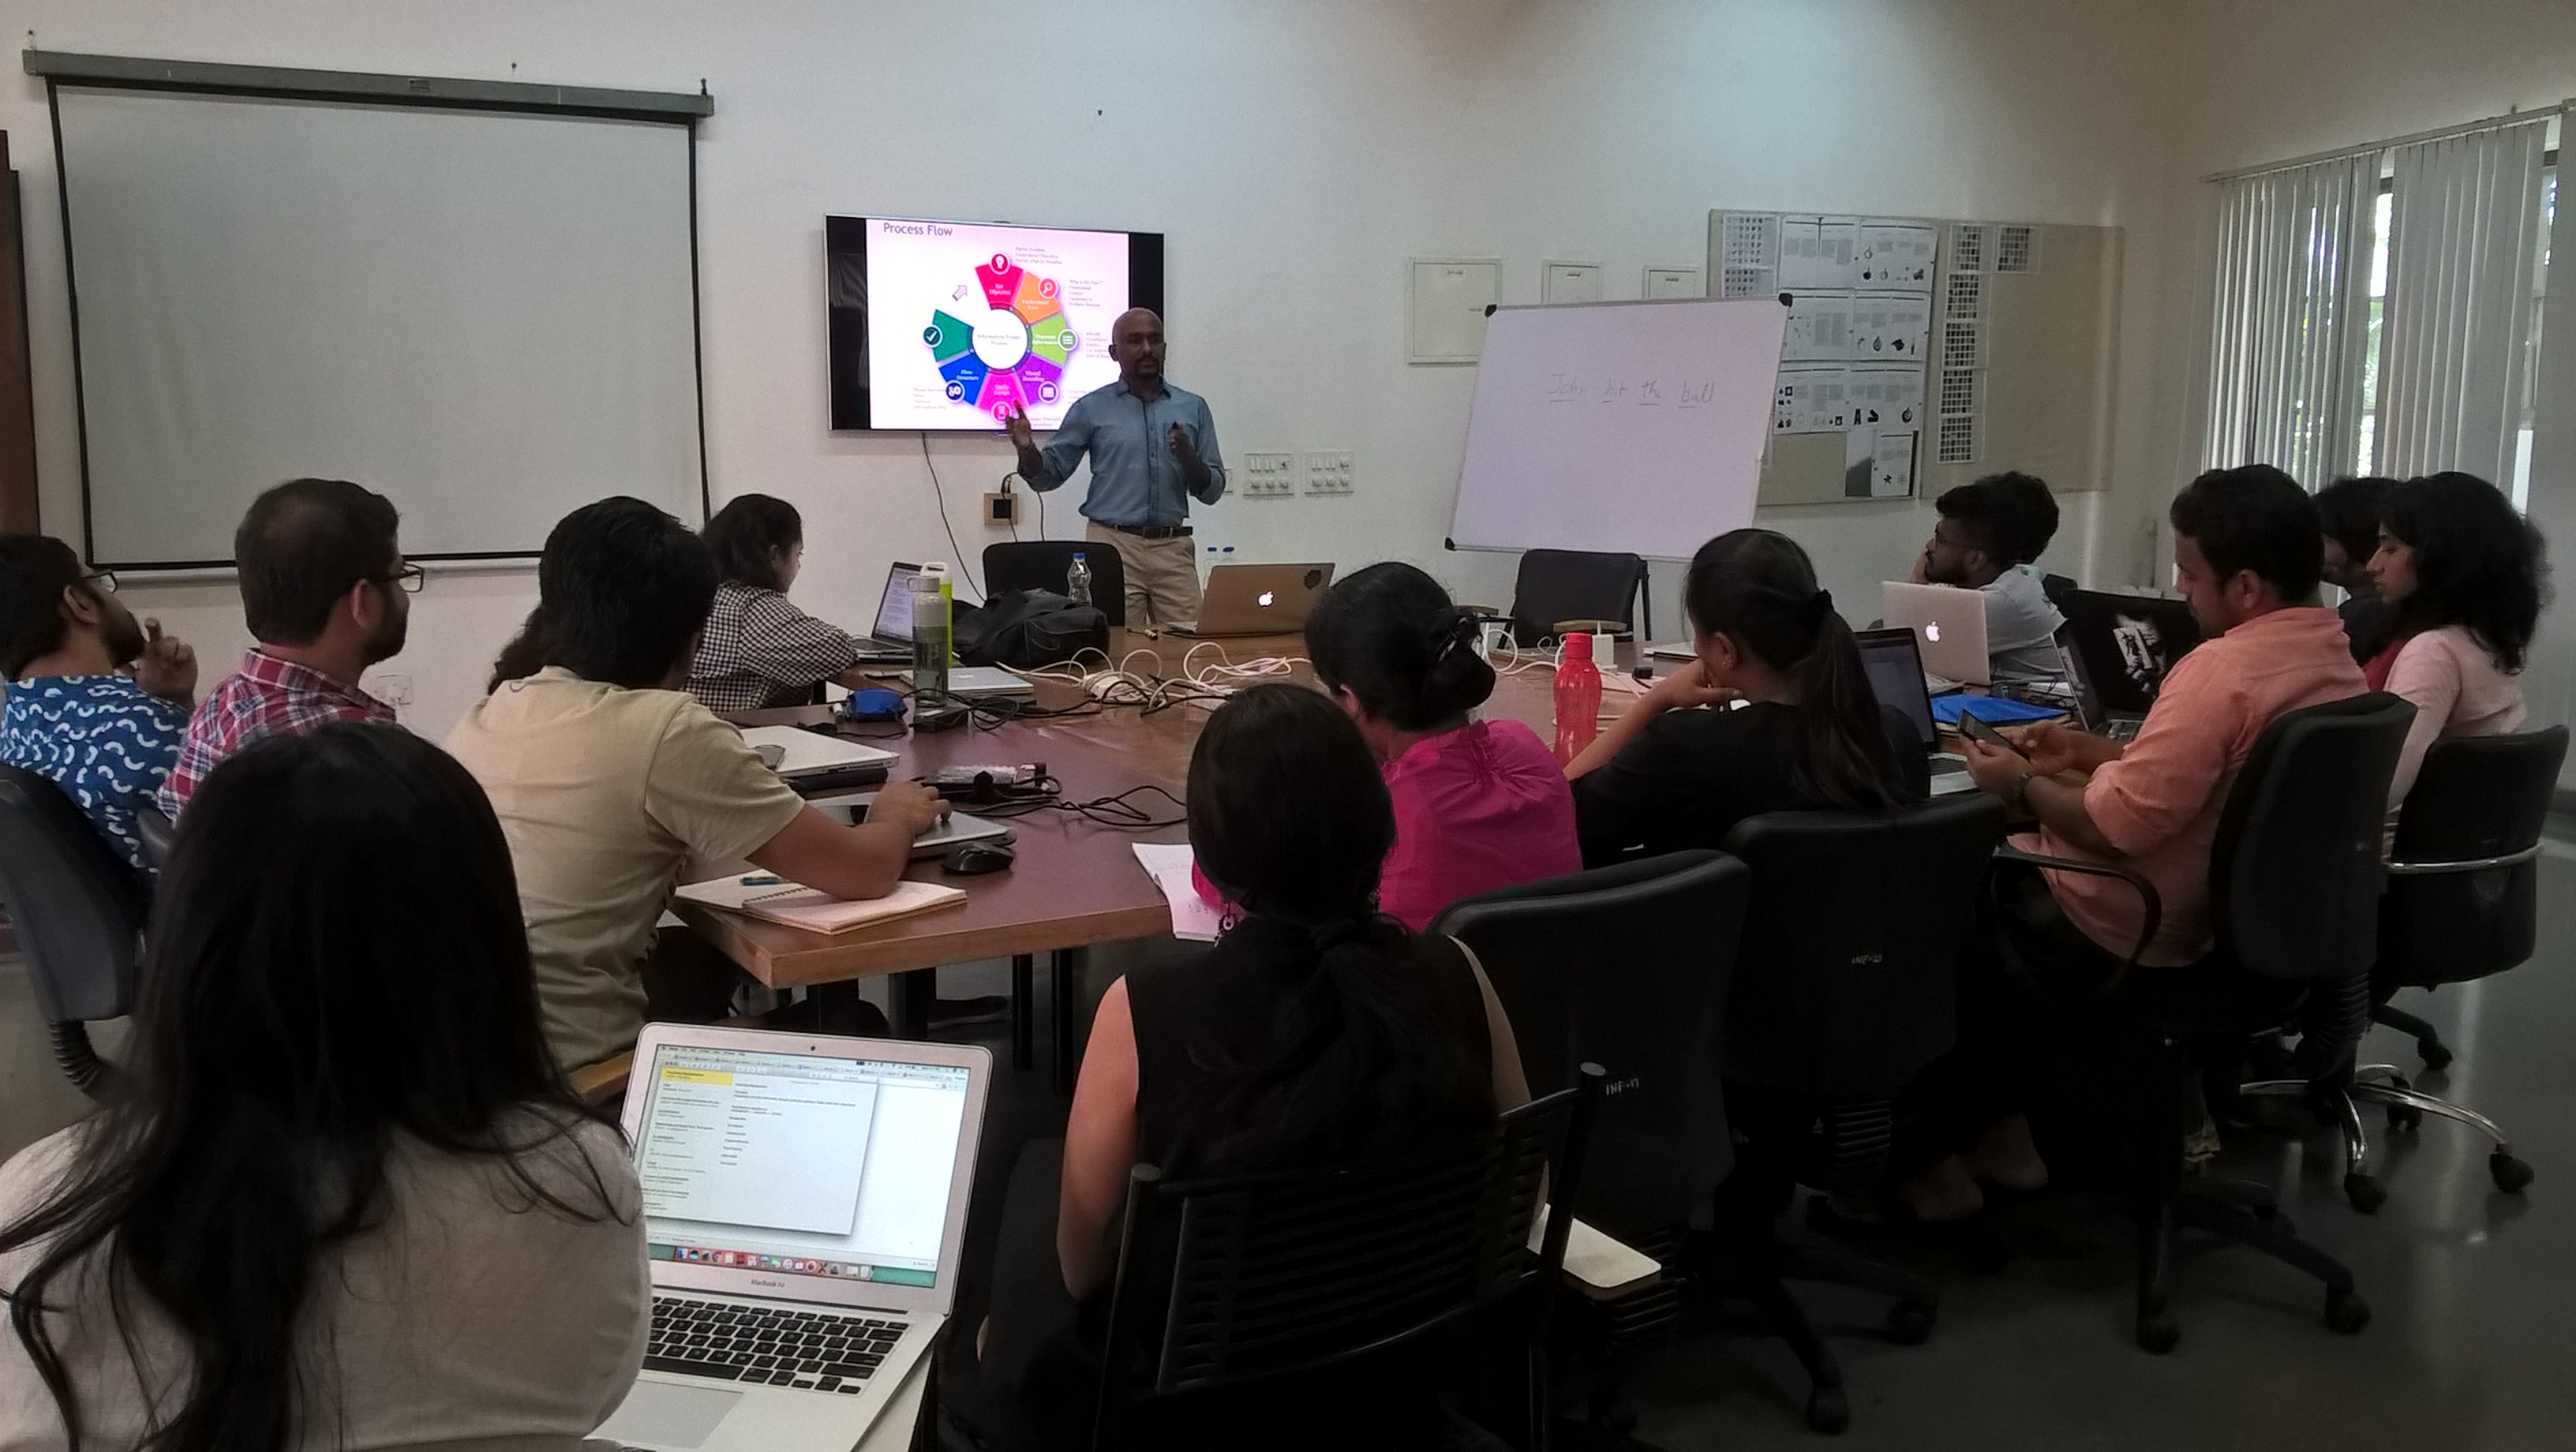
Finally, the learnings were put to practice through a live industry case-study wherein the students attempted to follow the entire data visualisation lifecycle with the provided data exercise. The students show exceptional interest and did a great job of assimilating the learnings and rapidly applying them by following the suggested visualisation process flow: requirements review – use case prioritisation – data analysis – design conceptualisation – finally the complete solution presentation.
The thirst for knowledge and quest to understand industry practices was evident with the volley of questions through the day, which were around areas including:
- Roles available for Information design in the field of Data science and the mix of skills needed, from amongst a combination of domain, math, stats, creativity and visual design
- Visualisation engagement lifecycle followed in the industry and the practical challenges encountered in requirements & design ideation
- Importance of data & exploratory analysis prior to embarking on the information design journey
- Addressing age-old issues of bridging gaps between design & development translation, while presenting information
- How one can adopt a user-centred design process to ensure that the solution meets user expectations
- Toolsets used to create stunning visualisations, and how adoption level in the industry to unconventional and newer, creative genres of information presentation
This session was a part of the ongoing industry outreach initiatives, under the partnership between Gramener and NID, Bangalore. As part of the partnership there are interactions and workshops scheduled for the students around the areas of Data Visualisation, Information Design and Cartographic visual representations.
Nice Article …. Thank you very much.
Annika