
Amid the darkness spread by the corona pandemic, we must continuously progress towards light and hope.
Narendra Modi
Prime Minister of India
Prime Minister Modi had appealed to India to switch off the lights and light a candle for 9 minutes on April 5 at 9 pm to show solidarity in the fight against COVID-19. Countrywide, there was a deep involvement in the occasion to show the collective will to conquer Coronavirus.
We would like to explore more in-depth the “9-minute Coronavirus lights-out campaign” and answer the following questions.
- Was the drop in demand for electricity the same as estimated by the Power System Operation Corporation (POSOCO)?
- Which states across India participated proactively?
- This event might have led to grid failure due to a sudden drop in demand if not correctly handled. How did our power boards take up the challenge and successfully achieve it?
India’s power grid
A grid is a network of power lines that link power generation stations (hydel, thermal, or nuclear) and the consumers (households, offices, or an industry). During the process, the demand at the consumer end needs to match the power production continuously. In simple words, the power that is generated must be used instantly; otherwise, the generation units will trip [1].
Therefore, the electricity department needed to plan and take measures accordingly during the sudden demand drop for 9 minutes. In India, the primary power generation sources are thermal, hydro, and gas. The electricity department regulated power generation at these sources on April 5 to avoid grid collapse.
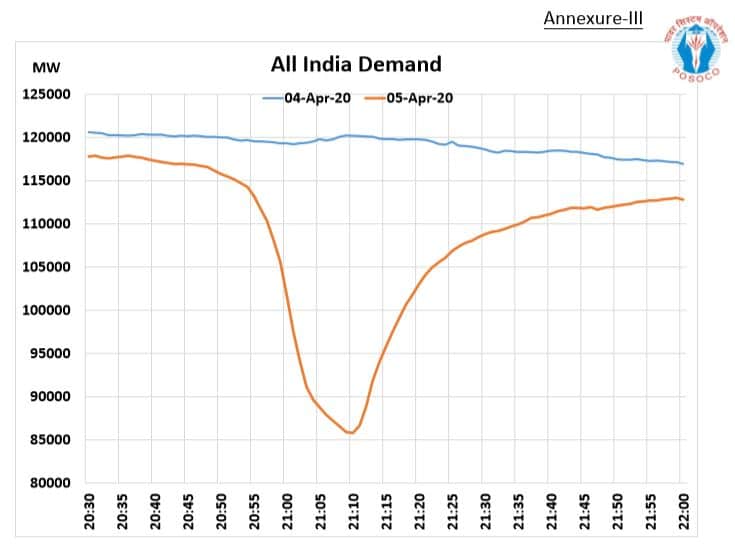
The demand on April 5 was on par with that of April 4 except for 9 minutes. The power consumption started to drop by 8.55 pm, reached the lowest point at 9.10 pm and recovered by 9.30 pm. Here are a few interesting insights from the data captured by POSOCO [2] during the 9-minute occurrence.
Did India’s power demand drop on April 5?
Power Boards and engineers across the country meticulously planned and carried out mock drills to handle the sharp drop in demand. As a part of the planning, they anticipated that demand would reduce by 20% for 9 minutes. This was considering that only lights would be switched off.
However, India’s demand fell by 35% during those 9 minutes. This hints that people turned off not just lights but other appliances as well. The graph below also points to the fact that the public across India extended their participation until 9.20 pm, possibly by enjoying the time in their balconies.
With the 12 GW reduced power consumption (from the switched-off lighting load) for 9 minutes, we can estimate that around 1,463 million lights were switched off across India. This means ~2 tube lights, and three bulbs per household. (A tube light and bulb consume 55 and 60 watts respectively per hour [3]).
The overall demand reduction of 32 GW across India is not a small number. Just imagine — 0.8 million Indian or 65,000 U.S. households can live for a year from the electricity saved in just 9 minutes on a single day! (A U.S. household consumes 1,334 watts per day, which is 13 times more than an Indian household as per EIA [4]).
Also, the data shows an interesting observation about population and participation. A higher number of people in a region did not guarantee higher engagement in the “9-minute lights out”.
Area-wise response to the Coronavirus lights-out campaign
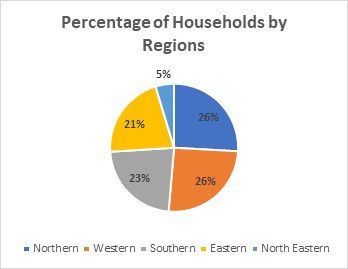
A majority (about 75%) of the population lives in the Southern, Western, and Northern regions of India. However, the region which contains just 5% of total households recorded the highest participation. The pie charts below represent the percentage of households across regions and their power consumption.
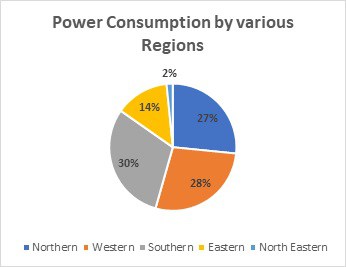
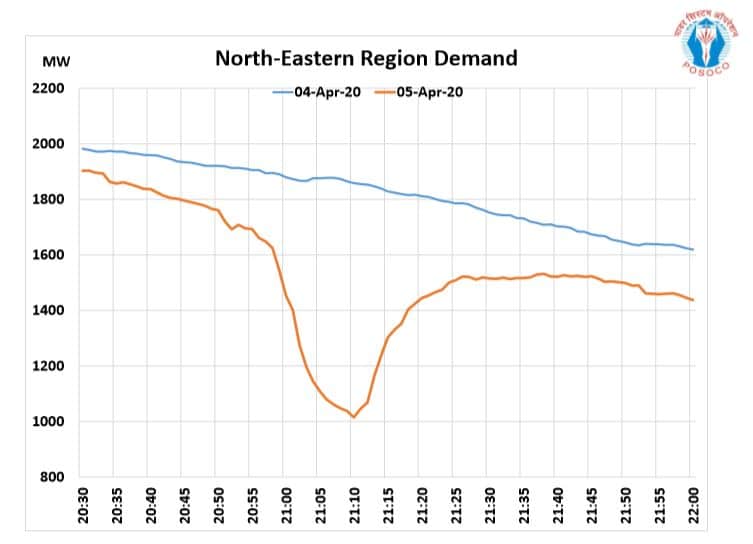
With a drop of 47% power usage (shown in the graph below) on April 5 between 9 and 9.10 pm compared to its previous day demand in the same time, it seems like the North-Eastern states proactively took part, followed by Eastern states with a demand drop of 41%. The remaining three regions recorded a lower participation rate of 20-31%.
How did power boards avoid grid collapse?
In India, thermal power plants (70%), hydro (14%) and gas (6%) are the major sources to meet the power demand for domestic purposes. To control the drastic drop in demand, power engineers regulated and reduced the energy generation at the three sources.
They planned to mainly use hydro and gas power plants to manage the dip and surge pattern of lightening loads. Hydro and gas-powered plants can support fast changes in load. Gas turbines can ramp up or ramp down rather quickly. Similarly, water can be stored in dams and reservoirs and can be released in a planned manner to achieve a sharp increase or decrease in hydropower. Coal plants have a more limited ability to handle sharp load variations [5].
It is fascinating to know from the data that, Electricity Boards did not reduce the power generation equally at hydro and gas plants (given that these sources handle the situation better compared to thermal). Instead, they reduced power generation based on how many of these power plants were present in the respective region.
For example, if a region had a higher number of hydroelectric power plants installed, they were used to control the fluctuation. This indicates the direct correlation between the presence of hydro/gas power plants in a region and their utilization to control the production.
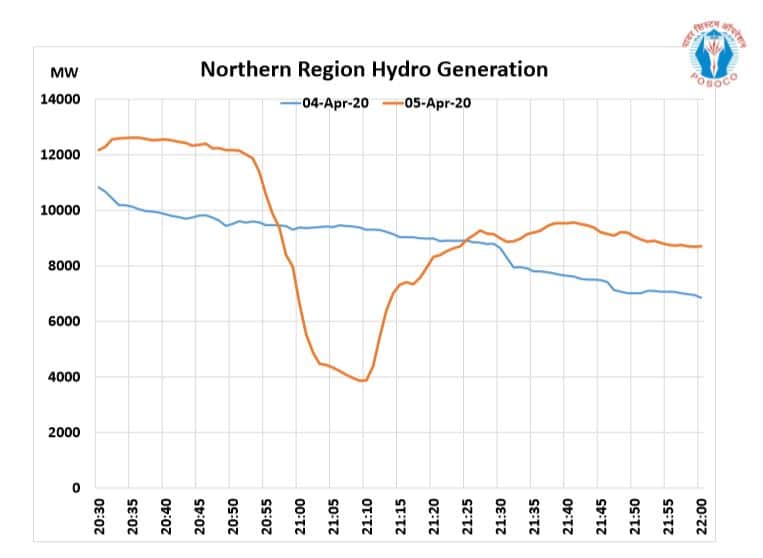
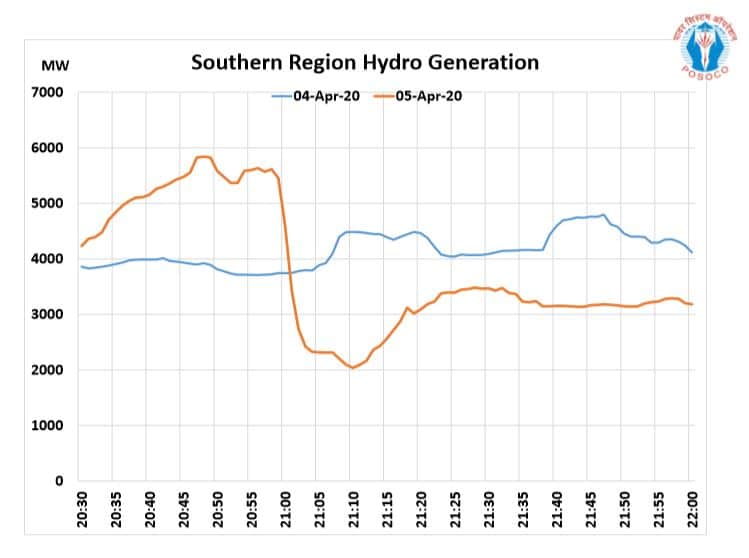
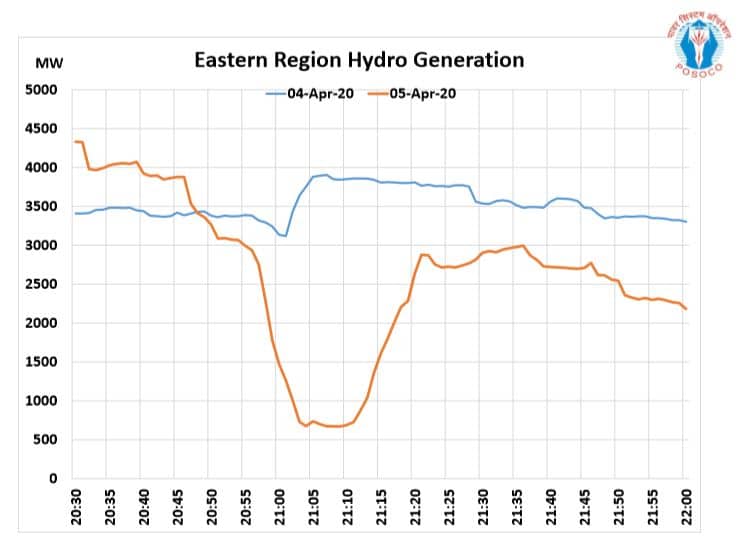
Impact of Coronavirus lights-out campaign in northern, southern, and eastern regions
There are about 30 hydroelectric powerhouses on average and about one gas power plant in each region. These places highly depend on hydropower plants to manage the loads. Hydropower generation dropped by about 55% (depicted in the graph below). On the other hand, gas power generation dropped by just 18%.
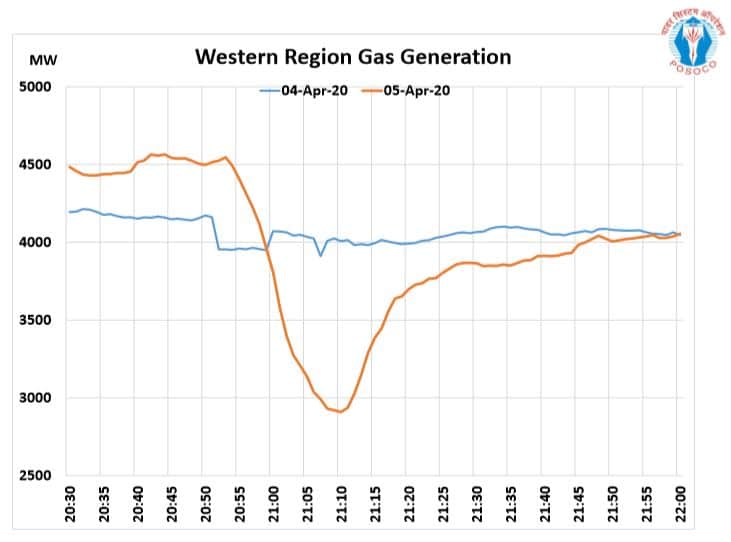
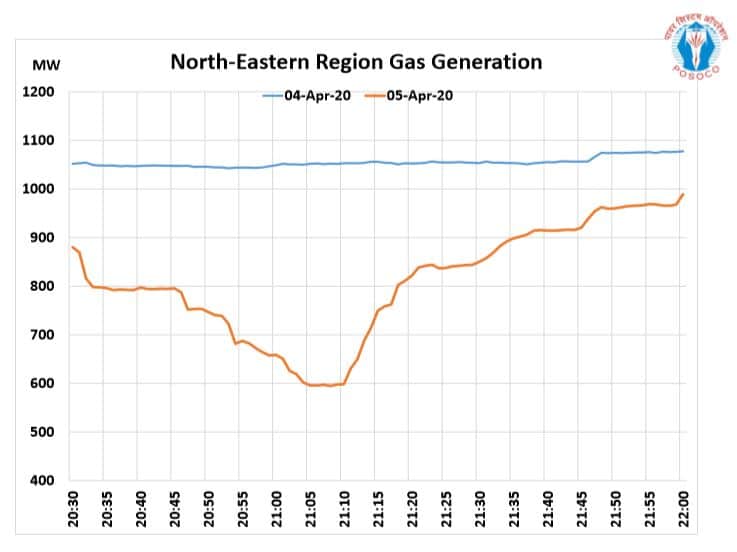
Impact on western and north-eastern regions
These regions have primarily used gas power plants to control the fluctuation in loads. Each region, on average, has about five gas power plants. Compared to other regions, gas power generation dropped by an average of 35% during the campaign. This shows that the regions are more dependent on gas power plants to manage the load. On the other hand, there was only a 13% drop in hydropower generation.
More Data Stories on Coronavirus
- Track the Spread of Coronavirus Worldwide. Our sources for the data are CDC, ECDC, WHO, and Johns Hopkins CSSE.
- Simulation to help Identify counties or districts with lower hospital capacity and resources
- A community-sourced set of simple best practices to follow to contain the spread of Covid-19. The messages are available in several Indian languages
- From canceling travel to extending sick leave, how are organizations tackling Covid-19? Here are insights from the NJTC survey of 250 business leaders in the U.S.
Very well articulated and insightful. Great work.