
Stories are interesting, captivating, and stay for a lifetime if narrated well. Did you ever think about why we get influenced by stories?
The simple answer is because it changes our perception and aids in making a decision. Inspirational rags-to-riches and life-changing stories motivate us, and we start implementing the same in our lives. Ain’t it?
Well, it’s the same with business decisions as well. Business storytelling backed with solid data insights and compelling narrative (Oral, Visual, or written) is enough to convince a client or a business user to buy your product. Let’s learn how you can craft a business story to sell your ideas and products.
[sitemap]
Let’s Start With a Business Story
Jenny needs to know which country would be good for her business to grow
Jenny, who is the founder of XYZ corp from California, USA, wants to expand her business to other geographies. She wants to start with finding potential geographical locations to set up her office in the South Asian Sub-continent.
She comes across World Bank’s Ease of Doing Business Index
The “Doing Business” report published by the International Bank for Reconstruction and Development is an annual report on the state of health of economies based on detailed diagnostics of underlying and embedded characteristics—such as the regulatory system, the efficacy of the bureaucracy and the nature of business governance.
But the data-set is huge and data insights are none
This report would help Jenny to narrow down factors such as Registering properties, Trading across borders, Electricity, Paying taxes, and so on. Furthermore, she could compare the countries based on these factors to find the best. But Jenny gets confused from the never-ending numbers and indexes in the ‘close-to-infinite’ excel sheet.
A visual storytelling with data is a good solution
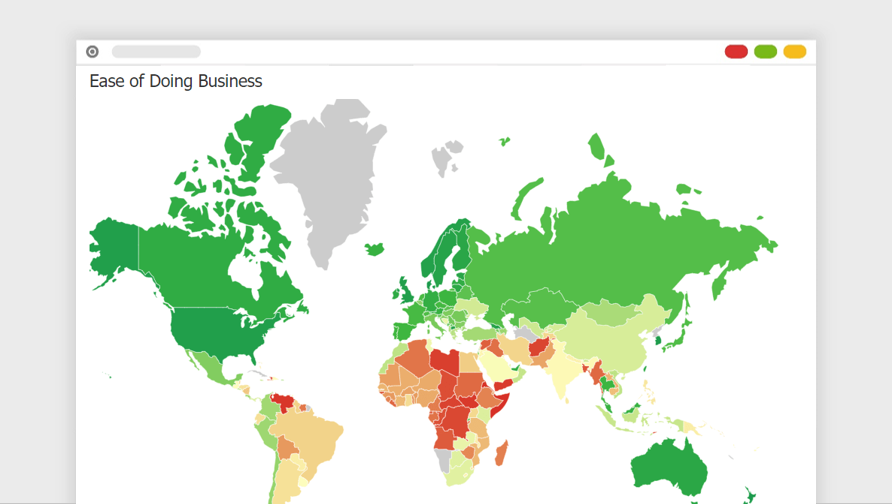
In such case, a data visual summary of all the factors mapped on the world map could be of extensive help to her.
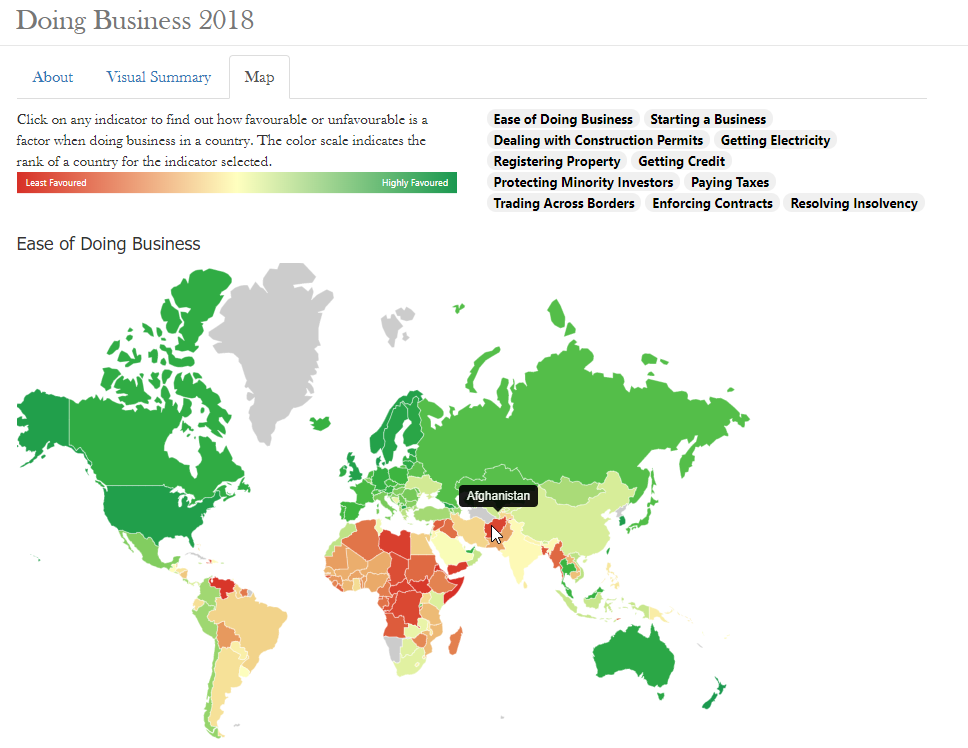
The map above from Gramener classifies all the countries based on the parameters listed at the right top of the picture. To draw quick visual insights, the countries are coloured from Red to Green based on the ease of doing business.
Jenny notices that Afghanistan is definitely not the right place to scale her business. But, why? Maybe its GDP per capita is less or perhaps difficulty in trading across borders due to the continuous internal conflicts between the government and the terrorist organizations.
Whatever the reason is, Afghanistan is not suitable from an ‘ease of doing business’ point of view.
Then which country is?
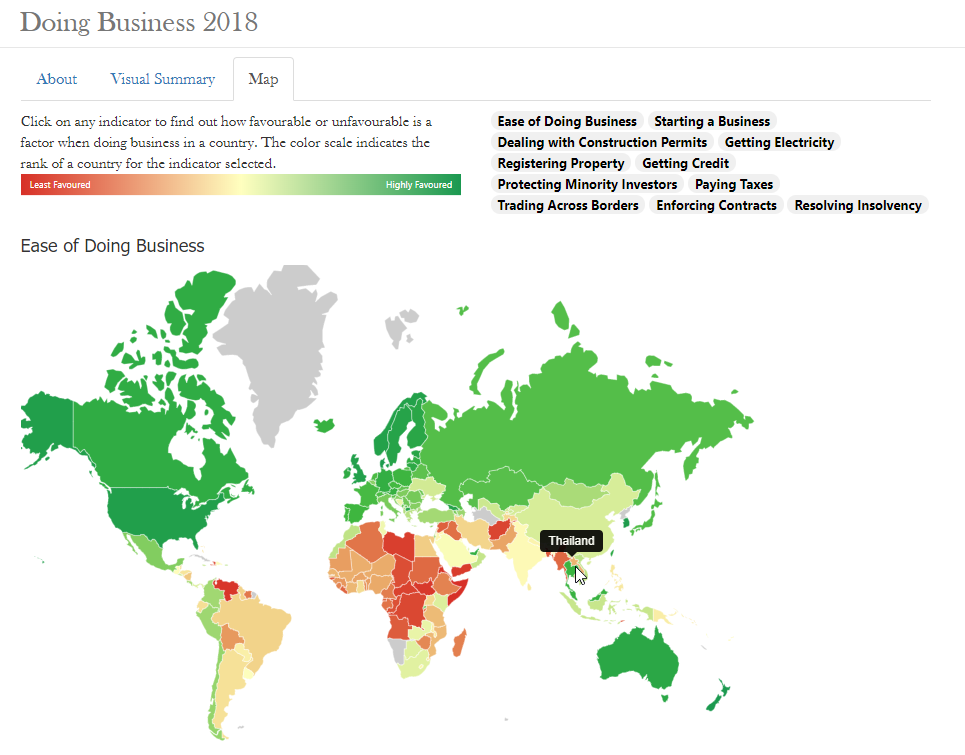
Thailand is ranked 27th out of 190 economies in the ease of doing
This analysis brings out yet another fascinating insight. The USA, which is the most powerful country with the most powerful currency is the most obvious answer to being a business-friendly country. But sadly it’s not.
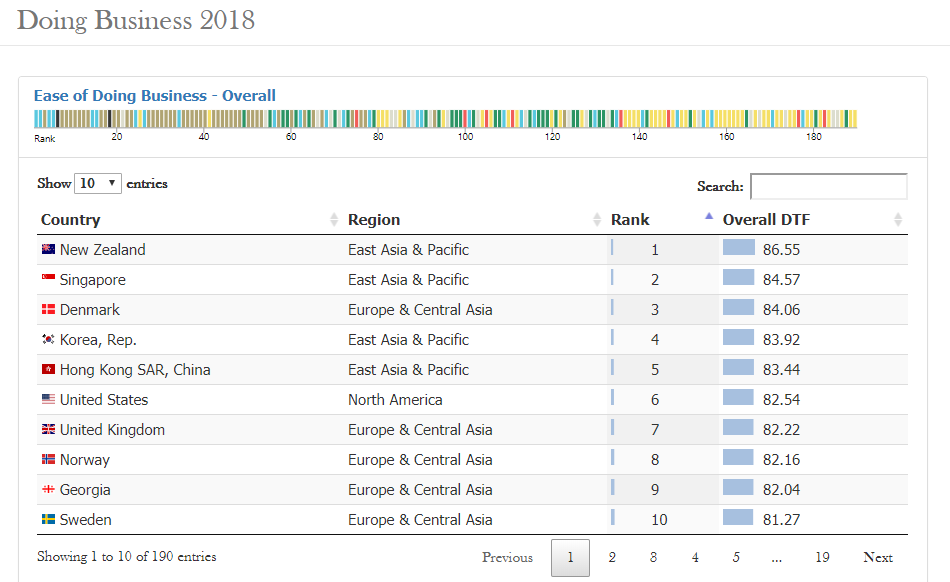
New Zealand is the most business-friendly country as per the 2018 data of the World Bank because it is a state that has the highest DTF Tax-Free Income. That was an example of how data insights and compelling narrative can bring out a beautiful business storytelling technique. It helps in making data-driven business decisions.
What is Business Storytelling?
One day the head of a Global IT hardware company approached us and said, “We have a huge customer base online and offline who give us a variety of feedbacks, positive & negative. We want to analyze it all to serve them better.”
With the help of sentiment analysis and impact analysis, we targeted the customer feedbacks in the form of text and developed a data application that could help our client improve their Net Promoter Score* (NPS). It helped them know the words their customers frequently used in the feedbacks such as customer service, technical support, response, etc. Furthermore, with our solution, their NPS grew by 6% driven by product and research.
That was a successful business story for you in a nutshell.
You can always elaborate it to answer more questions like ‘how’, ‘when’ and ‘where’. But any reader’s/listener’s judgment on a business engagement would heavily rely on the first two paragraphs.
Ingredients to Storytelling with Data

Data insights are a secret sauce to an exciting business story. You get numbers, figures, facts, and collaterals to believe the story to be true.
- A problem that a listener can relate to.
- An approach that the listener just thought would be a distant dream.
- A solution to make the listener believe in the possibilities of a happy ending.
- A narrative to bind the above three ingredients together and keep the listener engaged.
The facts, and data insights adds credibility to storytelling with data.
“Without storytelling, data offers just a rear-view mirror,”
Clive Humby
Co-founder, Dunnhumby
If done well, good business storytelling can become a ‘data-to-insights’ activator. It can help customers buy from you, turn your brand into a legacy, create a robust marketing strategy, generate profit and win the loyalty and affection of audiences, just to name a few.
How to Find Data Insights?
If it’s obvious, it’s not an insight. Data insights are non-obvious and can make you jump off your chair. The whole agenda of analytics circles around finding actionable insights that are not visible. There are 5 ways you can find insights from a large dataset.
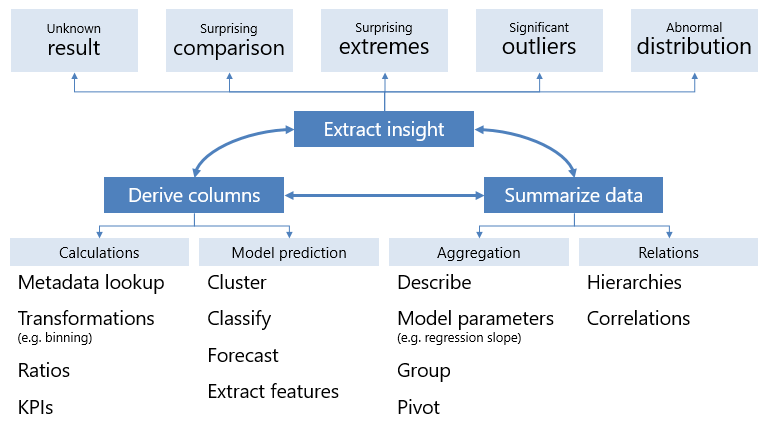
I. Unknown Result: When you are doing data analysis, there are high chances that you would find something that you don’t know about. For example, we know Lionel Messi is a great football player. But do we know shots/goals he has made against a particular team? Thought so. By analysing Messi’s game-data we got the following unknown results.

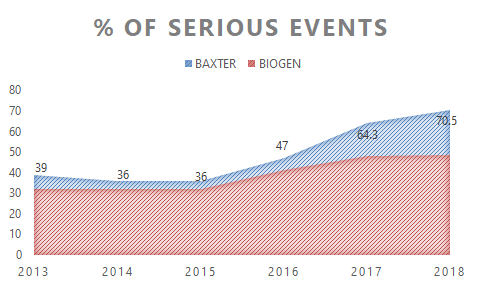
II. Surprising Comparison: When you compare one parameter with others and see the differences. For example, We compared the 5 years of data set from the Food and Drug Association. We found a few insights like the occupation of most drug adverse event reports, pharmaceuticals with maximum side-effect cases, etc.
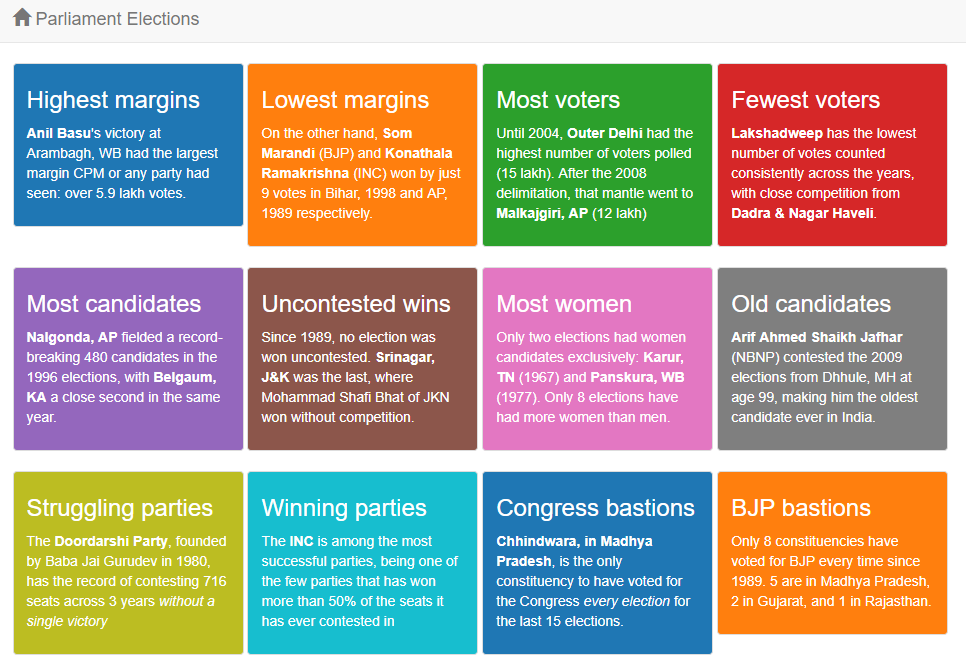
III. Surprising Extremes: When you get extremities in the data set where one parameter is impacting others with a difference. For example, we did a historical data analysis on Indian parliament elections. We found that Lakshadweep has the lowest number of votes counted consistently across years. However, Outer Delhi had the highest numbers of voters polled (15 lakhs).
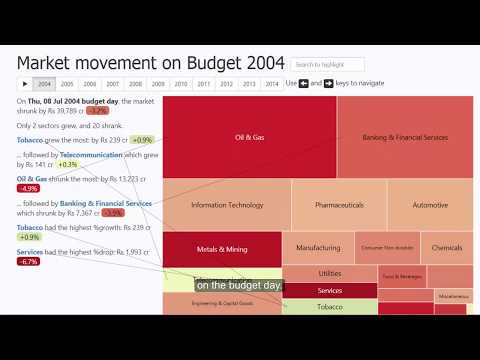
IV. Significant Outliers: When the differences are so large that the insights seem obvious. For example, Gramener’s budget visualization shows that the tobacco sector has seen a uniform uprising in the stock market when the yearly budget is announced. No matter what the price is tobacco consumption is never down.
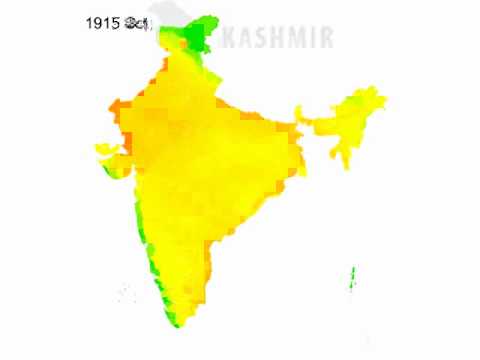
V. Abnormal distribution: Data distribution that shows unusual patterns can bring out an insight. For example, we did analysis on 100 years of weather data in India. Surprisingly we found one location, Bilaspur in Chattisgarh state, that gets cool when the nearby areas are hot and vice-versa.
How Business Storytelling impacts Decision-making?
Emotions + Narration. Stories help emotionally connect people. There are ways of business storytelling either through visuals or narratives, visuals being the top entertainers. Other benefits include:
- Generating meaning and purpose in projects.
- Developing empathy with a variety of audience.
- Understanding and involving the audience.
- Pitching a proposal from a sales standpoint.
- Promoting a business commitment.
- Extracting insights.
That’s how data insights and successful business stories play a vital role in making important decisions. Storytelling with data has now become vital for easy consumption of complex business data.
Finally, how did you like our post on Business storytelling with data insights for decision making? Write to us and tell your stories too.
* NPS, or Net Promoter Score, measures customer experience of your brand and provides the best metric to anchor your customer experience management.