
Updated on 31st March 2020. Even as the global coronavirus pandemic has tightened its grip on Europe, it is slowly loosening its hold on China and parts of Asia, where it originated. However, Europe and the United States are facing the darkest hours with rapid Coronavirus infliction. Here’s an analysis of the Coronavirus outbreak using the latest data from CDC, ECDC, W.H.O, and Johns Hopkins University.
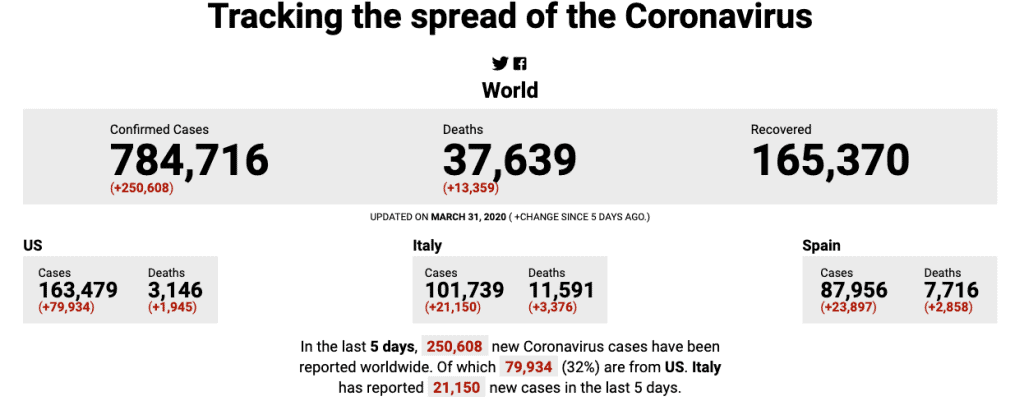
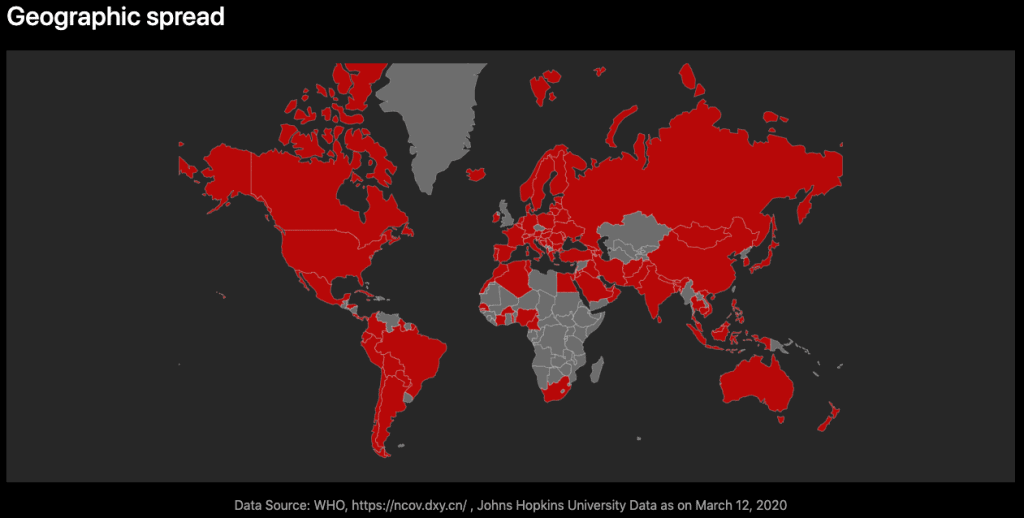
The virus has now spread to over 150 countries. According to the latest update on the coronavirus outbreak, 7,84,716 cases have been reported across the world. Out of which, 2,50,608 cases (31.9%) of coronavirus were reported in the last 5 days (26th – 31st march 2020).
The United States has surpassed every country in the number of Covid-19 positive cases (1,63,479 cases), followed by Italy (1,01,739 cases) and Spain (87,956 cases). The total number of cases has almost doubled in the U.S.A in the last 5 days (48.8% of new cases in the past 5 days).
A look at the data shows that since March 26th, China has controlled and decreased the spread of Coronavirus. However, the curve spiked in countries like the U.S.A as ~80,000 cases are tested Covid-19 positive in the last 5 days.
The state of Coronavirus cases in the USA
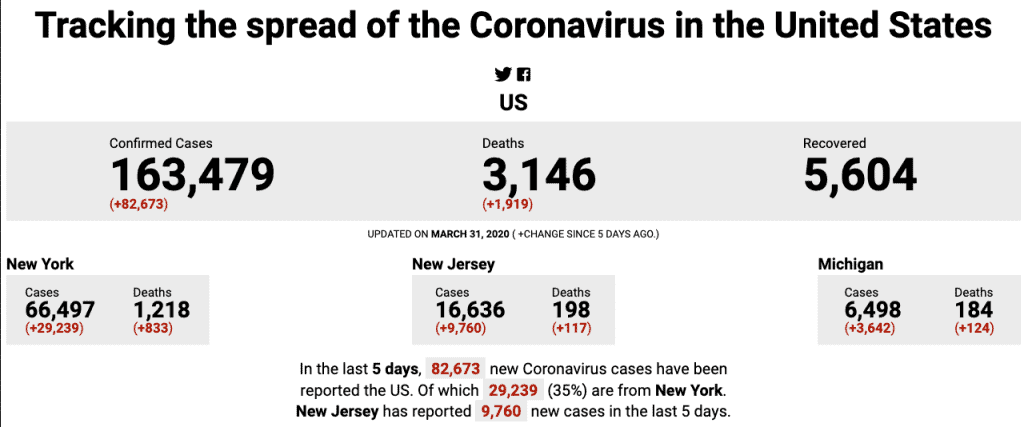
The United States which was way ahead in quarantining its people and states is now heavily under distress. Almost 48% of the Coronavirus cases have been tested positive in the last 5 days. The fatality rate in the USA has raised from 1.5% to 1.9% in just these 5 days.
3,146 people have died due to this epidemic in the USA, of which ~61% of people (1,945) have lost their lives in the past 5 days (26 – 31 March 2020).
Cities and States in the U.S.A which are most affected by Covid-19
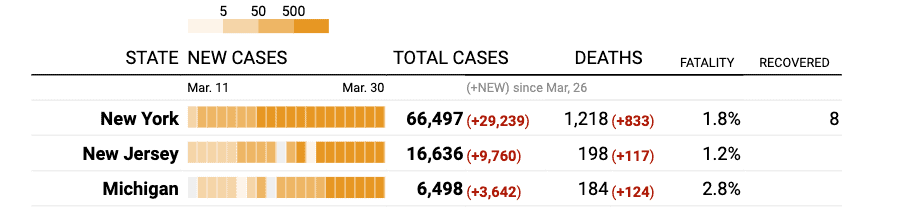
- New York, due to its dense population, is the most affected city from Covid-19 with 66,497 cases and 1218 deaths
- Unfortunately, in New York, 29,239 new cases and 833 deaths have been recorded in the past 5 days
- In New York, 8 lives have been saved so far
- ~68% of deaths have happened due to Coronavirus infection in New York in the last 5 days (March 26 – March 31)
- New Jersey has 16,636 Covid-19 positive cases. 9,760 cases (~58% cases) were tested positive since 26th March
- Michigan surpassed California this week in the list of cities with highest infected cases
The Recovery Stats on Coronavirus Cases is Improving?
The silver lining to the gloomy cloud of coronavirus — which has claimed 37,639 lives (13,370deaths in the past 5 days) — is that it has a relatively high rate of recovery if it is controlled like in the case of China.

The gradually decreasing color shades indicate the decreasing spread of Coronavirus in China. In the past 5 days, only 233 cases have been reported in China, which is way less than the situation a week back.
Hence, panic is not the answer to the problem (or to any other problem, really). With measures suggested by the WHO like hand sanitizing, social distancing and self-quarantine, the spread of the virus can be contained.
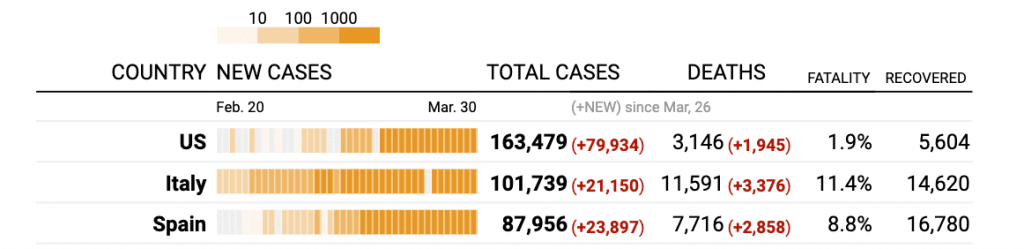
Italy and Spain have the highest fatality rate from Coronavirus
The total number of Covid-19 positive cases in Italy are still rising. In fact, in the last 5 days, Italy has recorded the highest number of deaths from Covid-19 (3,376 deaths).
The fatality rate of Coronavirus cases in Italy has increased from 10.1% last week to 11.4% this week.
Talking about Spain, it has the second-highest fatality rate from the effect of Covid19 (8.8% fatality rate).

Tracking the Spread of Coronavirus
At Gramener, we created an interactive data visualization on the spread of Coronavirus worldwide, in USA, in Europe, and in Asia that paints a comprehensive picture of the cumulative number of cases, deaths, fatality rate, and new cases and deaths reported from March 26-31.
Each stick in the visualization represents the number of cases on that day. Darker the color, higher the number of cases.
The color intensity of the bars shows the rise and fall in the number of cases. South Korea has shown a gradual decline in the number of covid19 cases. Japan has managed to limit the number of coronavirus cases over a sustained period. This shows us that countries in Asia have slowly managed to contain the virus (though the pandemic originated in this region)
With careful planning and prevention measures, the West can also flatten the curve of cases soon, as the Asian countries did.
Stay Quarantined, Stay Safe
For the next few days, follow the advice given by various governments across the world — stay home, stay sanitized and stay safe both for yourself and for the sake of your family and friends.

Restart a dormant hobby, read a book, do a puzzle or watch a movie, but stay put till the pandemic passes!
Here is an article for you to start: 100 things to do when you’re self-quarantining
Tracking the Severity of Coronavirus with Data
Here’s another dashboard we created to show the crisis of the pandemic on a global level. The Coronavirus Trail. The visual illustrates the breakdown of coronavirus across the world according to:
- The total number of confirmed cases
- The total number of death cases
- And, the total number of recovery cases
I have been an ardent follower of Gramener and Ganes Kesari articles on LinkedIn.