What is the Global Biodiversity Crisis?
Biological diversity comprises the variety of living things on the planet. It includes the natural patterns present in ecosystems, genetic variability, and different levels of biological organization. The global biodiversity crisis is the widespread disappearance and rapid decline of biological diversity globally.
The World Economic Forum’s 2023 Global Risks Report ranked ecosystem collapse and biodiversity loss among the top five threats to humanity in the coming decade. Between 1970 and 2018, monitored wildlife populations declined by 69% on average, as reported by the WWF Living Planet Report 2022. The current extinction rate is 10x to 100x more than the average over the last 10 million years. Further, an estimated 17% of forests have been lost, and evidence indicates that the world’s largest tropical forest is close to a tipping point. These unprecedented changes are referred to as the sixth mass extinction event, and it is expected to have far-reaching consequences on livelihoods, public health, and the global economy.
Table of Contents
What are the Causes of Biodiversity Loss?
Overexploitation of ocean resources is a significant factor in the declining health of marine biodiversity. Land-use change is the primary driver of biodiversity loss, driven by agriculture, the built environment, and infrastructure displacing natural ecosystems. The following are vital changes that illustrate the extent of these drivers:
- Land-use change: The food, land, and ocean use systems generate around 12% of annual global GDP or $10 Tn. Land use and agriculture are responsible for more than 80% of habitat loss and tropical deforestation. It uses more than 70% of all freshwaters.
- Industrial fishing: The total area in the oceans used for fishing has increased from 60% to 90%, driven primarily by commercial fleets expanding into new regions and targeting new species. 93% of industrial fishing is at or beyond maximum sustainable levels of fishing today.
- Urban and industrial development: Built environments are connected by infrastructure such as sea bridges, gas pipelines, and roads. This infrastructure can severely disrupt fragile ecosystems. According to some studies, the population of birds and mammals tends to be lower around such infrastructure by up to 5 kms.
- Resource extraction: From 1970 to 2017, global resource extraction has grown threefold from 27 Bn tons to 92 Bn tons. Even though it uses less than 1% of land area worldwide, mining utilizes toxic and damaging extraction techniques.
- Commercial deep-sea mining: This is expected to become operational within the next decade and will only increase the risks to the world’s oceans.
It is important to note that multiple pressures contribute to the biodiversity crisis. In 2009, a team of experts led by the Stockholm Resilience Centre published the Planetary Boundaries Framework. This framework outlines nine fundamental human-induced changes to the natural environment, referred to as planetary boundaries, that threaten the stability of the entire Earth System. Apart from biodiversity integrity, the others are the release of novel chemicals (heavy metals, radioactive materials, plastics, etc.), land system change, freshwater use, biogeochemical flows of phosphorus and nitrogen, atmospheric aerosol pollution, depletion of the ozone layer, ocean acidification and climate change. Many of these are inter-connected. For example, the climate crisis further aggravates biodiversity integrity loss as species struggle to cope with rapidly warming environments and acidifying oceans.
What are the Impacts of Biodiversity Loss?
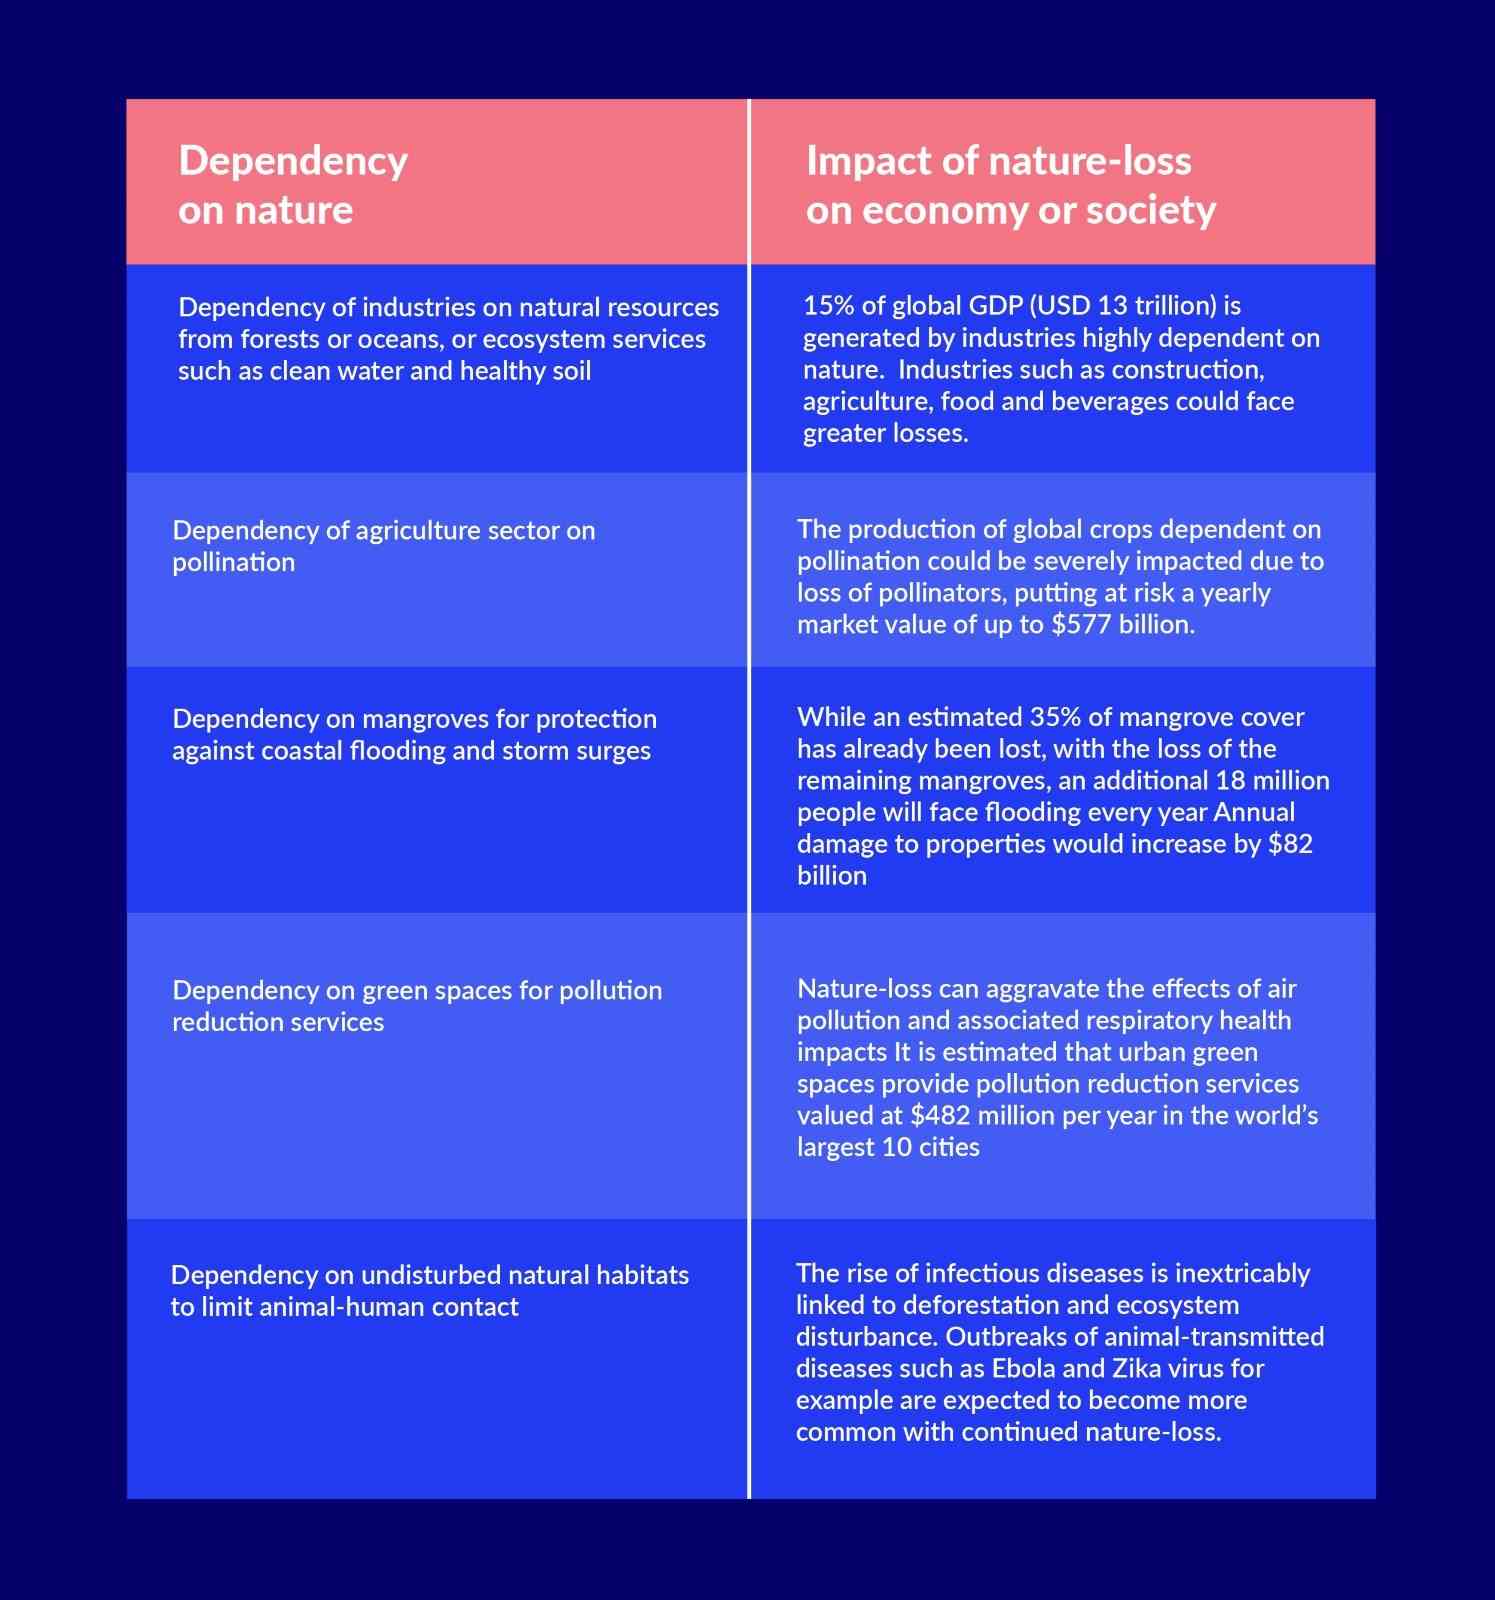
More than half of the global economy is moderately or highly dependent on nature and the ecosystem services it offers, according to the World Economic Forum. This means that an estimated $44 trillion in economic value generation is potentially at risk from nature loss. The following are examples of specific economic and social impacts expected due to the biodiversity crisis.
In the next section, we explore the recently concluded COP15, where global leaders met to discuss and take steps to stop and undo the damage already done to the natural balance worldwide.
COP-15: Significance and Highlights
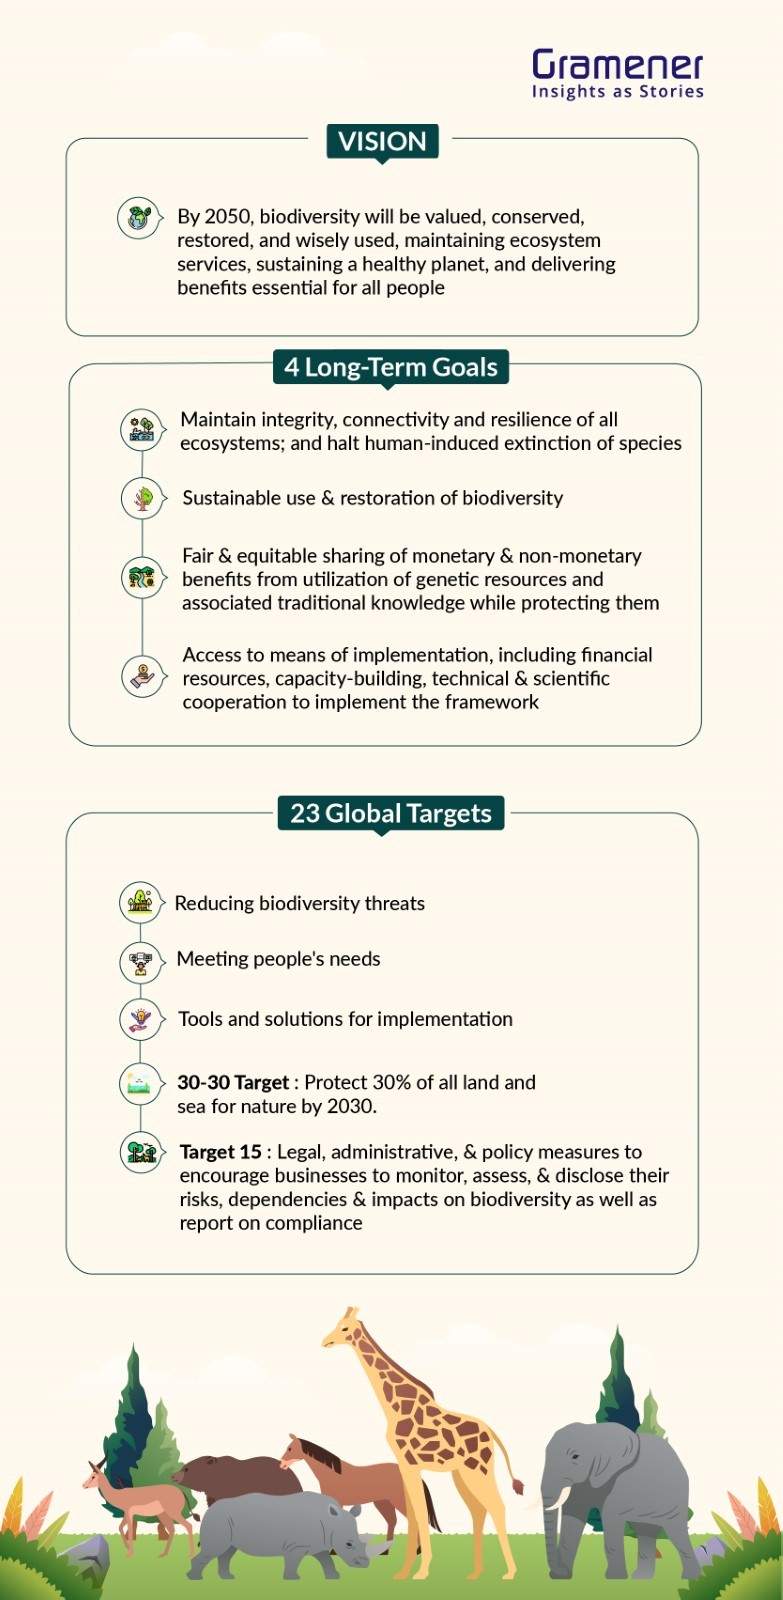
The 15th United Nations Conference of the Parties (COP-15) to the UN Convention on Biological Diversity (CBD) was held for two weeks in Montreal, Canada, from December 7 – 19, 2022. Representatives from 188 governments, or 95% of the 196 members of the UN CBD, along with two non-parties, the Vatican and the United States, attended the conference and signed on a historic package of critical measures that would help restore natural ecosystems and arrest dangerous loss of biodiversity. Hosted by Canada and chaired by China, COP-15 adopted the “Kunming-Montreal Global Biodiversity framework” (GBF) that comprised four goals and 23 targets for achievement by 2030.
See the detailed list of targets here.
The following are some of the highlights from this recently concluded conference.
The 30X30 Target
One target that grabbed the most attention from the media and is the most recognizable outcome of COP15 is the commitment to protect 30% of all terrestrial, inland water, coastal and marine areas by 2030. Protecting the land and seas is vital to tackling both biodiversity loss and climate change. Speeches and articles have compared the importance of the 30X30 target of the Global Biodiversity Framework (GBF) to the 1.5C temperature goal of the Paris Agreement.
In January 2021, the One Planet Summit in Paris officially asked for the 30X30 target to be included in the GBF. France and Costa Rica led a group of 50 nations to commit to the target and persuade other countries to sign up. Around early December 2022, before COP15, 114 out of 196 countries that are party to the Convention on Biological Diversity (CBD) came out in public to support the target.
Target 15
Target 15 of the GBF calls for governments to encourage large transnational businesses and financial institutions to:
- Regularly monitor, assess, and transparently disclose their risks, dependencies, and impacts on biodiversity, including with requirements for all large as well as transnational companies and financial institutions along their operations, supply, and value chains, and portfolios;
- Provide information needed to consumers to promote sustainable consumption patterns;
- Report on compliance with access and benefit-sharing regulations and measures, as applicable;
This echoes changes already being considered by regulators in various countries to introduce mandatory biodiversity disclosures for large companies and financial institutions.
Biodiversity Finance
The GBF seeks to mobilize a minimum of $200 Bn annually by 2030 from all sources, whether private, public, international, or domestic. Developed countries and other volunteers are expected to increase their annual international financial contributions to at least $20 Bn by 2025 and at least $30 Bn by 2030.
This financial aid will help small island developing states, least-developed countries, and economies in transition meet their national biodiversity goals. The larger $200 Bn would include philanthropic funds, private finance, and other sources. The following are some pledges made in support of this larger goal:
- Canada pledged CAD 350 Mn or USD 258 Mn to help developing countries advance their conservation efforts.
- The EU has pledged €7 Bn from 2021 – 2027, especially towards biodiversity conservation in the most vulnerable countries.
- Germany has pledged to increase its international biodiversity funding to €1.5 Bn (USD 1.6 Bn) by 2025.
- The Bezos Earth Fund has also pledged USD 110 Mn in grants.
On 19th December 2022, the resource mobilization strategy document was published by the COP presidency. In it, the Global Environment Facility (GEF) is requested to establish a Special Trust Fund known as the Global Biodiversity Framework Fund (GBF Fund) in 2023 that will fund the framework through 2030. This fund will be overseen by a governing body dedicated to achieving the GBF objectives. It will be open to receiving financing from all sources, including official development assistance.
What Progress Can We Expect Before COP16 in 2024?
The CBD COPs convene every alternate year, unlike the UN climate conferences. COP16 will be held in Turkey in the 2nd half of 2024. The CBD has asked countries from eastern and central Europe to submit hosting bids for COP17 and the Caribbean and Latin American countries for COP18, respectively.
With the new framework approved, convention members must revisit their National Biodiversity Strategies and Action Plans (NBSAPs). The NBSAP comprises a nation-by-nation plan of how each will align with the targets laid out in the GBF.
While governments work on their national biodiversity plans, businesses are also working to track and manage their exposure to nature-related risks in their supply chains. As Target 15 of the GBF calls for introducing biodiversity disclosures for businesses and financial institutions, leading firms are proactively working on tracking these impacts in their supply chain. Some collaborative initiatives to develop frameworks and guidelines for businesses to manage biodiversity and nature loss include the TNFD Forum and the Science Based Targets Network. The latter aims to guide companies to adopt targets to reduce and reverse nature loss. In contrast, the former is aimed at providing guidance for managing and disclosing the financial impacts of nature-related risks.
The following section discusses how technologies such as industry 4.0 solutions can be powerful allies for governments and businesses to track biodiversity and nature loss.
Role of Technology in Biodiversity Management
Fourth Industrial Revolution technologies will power the next stage of nature-positive development. These technologies can improve agriculture’s resource efficiency and enhance the monitoring of nature loss and natural regeneration. The following are a few examples of technology in action.
Trase: Monitoring Deforestation in Supply Chains
The Trase tool combines publicly available from multiple sources to establish the connections between commodity supply chains and deforestation worldwide. Trase also combines self-disclosed data from companies with customs, shipping, tax, logistics, and other data to map supply chain routes and patterns of ownership.
The tool offers insights into commodities, including soy, palm oil, timber, and beef. For example, the tool has established that the soy trade is highly concentrated, with four traders handling 50% of all exports. These exports account for 43% of soy deforestation risk. 1% of soy-producing municipalities (18 out of 2318) account for 50% of all soy deforestation risk stemming from Brazil’s soy exports.
Impact Observatory: AI-powered Geospatial Monitoring of Environmental Risk
Understanding patterns in land use and land cover (LULC) change can offer crucial insights into fluxes in the natural carbon storage, loss of ecosystem services, resource exploitation, and biodiversity habitat reduction. Impact Observatory has built deep-learning algorithms that create dynamic and global LULC time series datasets using 10m Sentinel-2 imagery to monitor impact and inform decision-making.
The LULC maps generated by Impact Observatory are created via a dataset of billions of human-labeled pixels to train the machine learning models for classifying land. The models automatically classify water, trees, crops, flooded vegetation, built area, and other geographic features. This enables tracking changes over time, such as the expansion of agricultural land, deforestation impacts in supply chains, growth of cities, or change to water bodies. Impact Observatory maps are accessible via Microsoft Azure Planetary Computer.
NatureMetrics: DNA-Based Approaches
91% of ocean species and 86% of land species remain undiscovered. This poses a significant challenge to traditional sampling, which struggles to scale over time, space, and species. As the importance of biodiversity monitoring grows, so does the need to capture the characteristics of communities and species that drive entire ecosystems.
Environmental DNA (eDNA) involves identifying species based on the traces they leave behind in the environment or through sampling the organisms. These individual traces are matched to reference repositories comprising thousands of species, delivering a unique understanding of entire biological communities.
Ample studies demonstrate DNA-based methods to be superior to conventional survey methods for many groups and species. It also increases taxonomic resolution, detection sensitivity, and results in survey and cost effort advantages. For example, NatureMetrics can survey more species in just 10% of the field time of traditional approaches.
eDNA has a relatively low-tech approach to field data collection, making it more accessible to stakeholders such as local communities. DNA-based surveys are easier to conduct and replicate. Field-based species detection subjectivity is removed by automating species detection in the lab. DNA samples can also be stored for extended periods, making it possible to audit future biodiversity claims.
Microsoft’s Planetary Computer
The Planetary Computer is a Microsoft initiative comprising a multi-petabyte global environmental data repository. The platform consists of four main components: a catalog of data on Earth systems hosted on Azure, APIs that allow users to utilize the data effectively, the Hub – a computing environment for processing large amounts of geospatial data, and applications built by a network of Microsoft partners.
A few examples of the datasets that Planetary Computers combines include air quality sensor data, biodiversity data, forest inventories, climate/weather data, digital elevation maps, demographics, forest fire databases, land use/ land cover, etc. Planetary Computer uses open-source tools and supports open standards.
Google’s Dynamic World
The Dynamic world is a 10m near-real-time (NRT) Land Use/Land Cover (LULC) dataset comprising class probabilities and label information for nine land cover types. The dataset is built using the Google Earth Engine and AI Platform. The dynamic world is the result of a partnership between Google and the World Resources Institute.
The dynamic world uses the Copernicus Sentinel-2 satellite to take images. The tool uses cloud computing and AI to classify individual pixels in satellite imagery. Each pixel represents ~1,100 sq. ft. of land, and Dynamic world helps ascertain if the satellite imagery contains ice, grass, bare ground, crops, trees, built-up areas, flooded vegetation, or water. The tool can produce ~5000 images a day using data that is only two days old. By contrast, traditional models can take months to produce land cover data, often only annually. Land cover data that is frequently updated helps scientists map and monitor dynamic landscapes and address urban growth planning, natural disasters, deforestation, and food security. Scientists can use this land cover data to build systems that track constantly changing ecosystems and monitor planetary health.
Conclusion
In this article, we covered what global biodiversity is, its causes, and its impact. We also covered the recently concluded COP15 summit and its significance and highlights. Building on the momentum of COP15, accounting for business impacts on biodiversity and tracking national biodiversity plans are expected to become increasingly important with the regulatory changes to come. Technology is essential for monitoring biodiversity data, tracking land use /land change using geospatial data and monitoring biodiversity risks in supply chains.
At Gramener, we specialize in providing innovative AI and ML solutions that have already been applied for tracking biodiversity data. If you want to accentuate your ESG initiatives using the power of AI, connect with us today.