We are living in a connected age where advanced GIS techniques like spatial analytics are fueling rapid transformation. There are many examples where spatial analysis is helping various government and non-government agencies make decisions for their interventions. Location-based data is also proving to be a critical factor in improving the effectiveness of public welfare programs and uncovering new opportunities.
According to a McKinsey study, the accelerated use of location-based information, which also powers the Internet of Things, is likely to generate an economic value of up to $11.1 trillion a year by 2025. The prolific rise of spatial analytics means that its applications are far and wide today.
This article takes a look at spatial analysis examples that are changing the world for the better.
Table of Contents

What is Spatial Analysis?
Spatial analysis is the process of examining attributes, locations, and relationships between features of spatial data. It uses analytics, computational models, and algorithms to address a pain point or mine useful knowledge.
Spatial analysis generates actionable insights of value from spatial data. It has many applications, including emergency management, urban management, logistics modeling, disease mapping, and natural resource management.
We can use spatial analysis to build more resilient cities, improve quality of life, regulate traffic in an urban ecosystem, control the spread of diseases and even map a strategy for mass vaccinations during a pandemic.
Benefits of Spatial Analysis
The technology of spatial analysis has widespread applications, both in the private and the public sectors. It can be used to benefit local communities or habitats and also tackle global challenges. Analyzing time-lapsed spatial data can identify patterns and trends and predict future events with great accuracy.
Manual analysis of images captured by satellites is time-consuming and expensive. It is also prone to errors. Spatial data analytics employs AI and ML applications to process vast amounts of data at a fraction of the cost and time and with a high degree of precision.
Users can deploy spatial analytics to make well-informed decisions. It can provide a bird’s eye view of the area of concern, offer historical context for present occurrences and enable stakeholders to plan for future contingencies.
The spatial analysis makes it easy for users to grasp complex spatial data and understand their significance. This understanding helps devise strategies and implement initiatives that serve everyone’s best interests.
Why is Spatial Analysis Important?
The spatial analysis goes beyond simple mapping and allows users to visualize the variables interact with each other. By consolidating information from multiple sources, it offers a unique perspective to decision-makers looking to use this information to take action.
The technology of spatial analysis plays a role in our day-to-day lives. From using an app to book a taxi, tracking the location progress of deliveries, or using GPS to move from one place to another, spatial analysis has rapidly become an indispensable part of our daily lives.
Spatial data such as satellite imagery, etc., has been around for quite some time. However, extracting usable information from massive quantities of data posed a challenge. Fortunately, with the advent of modern applications using AI and ML, spatial analysis can process the data efficiently and deliver vital insights that can increase profits and even save lives.
Types of Spatial Analysis
One of the aspects that help GIS stand out is its ability to conduct analysis. One of its applications, spatial analysis, involves geographic modeling of spatial problems. Experts then use advanced processing methods to generate results and analyze them for further application. This analysis is helpful to identify the geographic suitability of locations for various interventions.
Different types of spatial analysis can help planners estimate outcomes, understand change and unearth unique insights hidden in data. The usage of spatial analysis is not complex, as even beginner-level individuals in GIS can get started with it. Some noteworthy examples of geospatial data include data exploration and modeling with GIS tools.
Examples of Spatial Analysis Urban Development
The spatial analysis aids in the solution of complex problems and provides insight and helps us understand where and what is happening in the world. Here are some spatial analysis examples in urban development:
Building Urban Resilient Cities with Geospatial AI
One of the challenging aspects today for policymakers worldwide is to reduce the risks related to climate change. GIS technologies help in understanding complex situations better and offering concrete Geospatial solutions. Planning bodies can leverage technology to assess and implement sustainable programs for the future.
GIS frameworks offer a scientific understanding of earth systems that lead to better decision-making. Some GIS analysis examples are as follows.
- Deforestation analysis to enable reforestation programs
- Sea level analysis to measure rising levels and the threats they pose
- Assessment of emissions and preparing for alternative energy sources
With Evergreen Canada, one of our clients from the ESG sector, we built AI for Resilient City. It’s an AI-driven 3-D data visualization tool that aims to help municipalities across Canada plan for and mitigate the impacts of climate change.
Download Case Study: Find out how Gramener built AI for Resilient City with Evergreen Canada

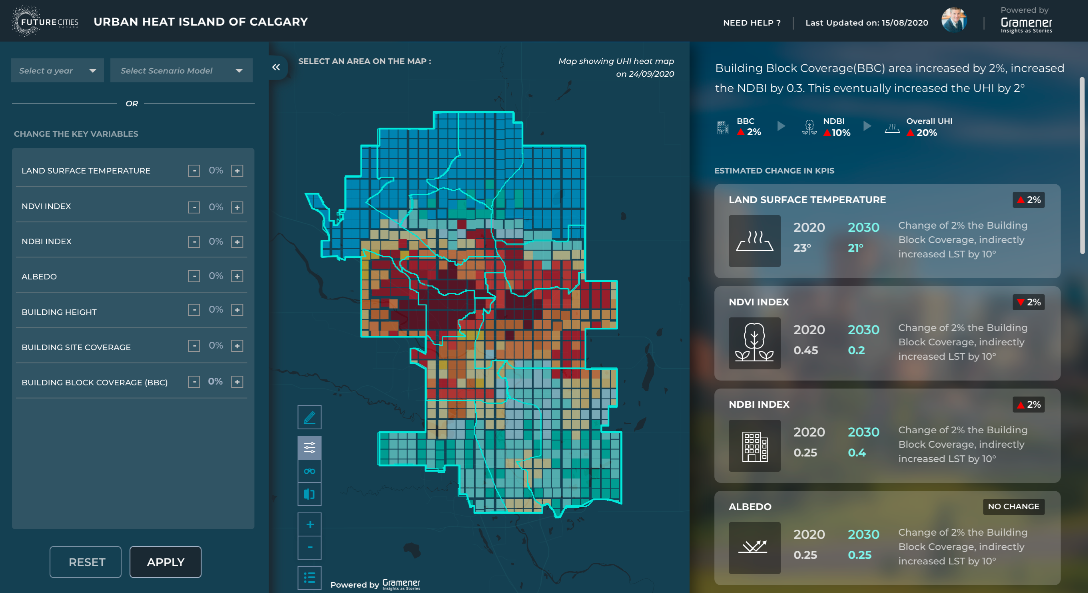
Reducing UHI Effect Using Geospatial Technology
This spatial analysis example talks about urbanization, leading to the Urban heat island (UHI) effect. As one of the severe climatic implications, it remains a concern for environmentalists. Measures like thermal remote sensing help in a better understanding of the relationship between urbanization and climate. Landsat satellite data and field observations can help identify the spatial pattern of the surface and the subsequent UHI effect.
In addition to our work with Evergreen Canada, we’ve enabled the AI for Resilient city tool can generate an integrated picture of a wide range of data, allowing municipal stakeholders to identify which parts of the city are most affected by UHI and forecasting future UHI levels across the city. The knowledge may then be used by the municipality to plan for a future that is more climate-resilient.
Predicting Quality of Life with Satellite Imagery
The spatial structure of a geographical area plays a vital role in the lives of its inhabitants. To ensure the quality of life of inhabitants, planners need better insights for effective decision-making. So, improved knowledge of spatial structures and related socio-economic levels is vital.
Spatial pattern metrics from local climate zone classification helps in this aspect. It becomes available by combining open GIS data, remote sensing, and machine learning. The data helps in identifying a relationship between socioeconomic variables and spatial pattern metrics.
Some examples of variables include healthcare, education, and transportation. These variables also help in grouping areas of any geography based on the quality of life they offer.
Apparently, we built an AI-driven application to predict the quality of life by evaluating the socioeconomic data. This application leverages Deep Learning to process images captured from satellite, enriched with census data and offers insights about rising in urbanization and poverty, and anomalies in census-measured factors like literacy, employment, and healthcare.
Traffic Analysis
One of the better ways to identify problems in transportation systems is by modeling public transit accessibility and traffic congestion. Traffic modeling also helps in identifying road stretches that often exceed their capacity levels. People, usually in the low-income groups, lack vehicles which make transit more difficult for them.
So inadequate public transportation can impact their ability to access employment and other amenities freely. In many cases, public transportation does not cover every neighborhood. Similarly, traffic congestion makes them unreliable.
Examples of Spatial Analysis in Public Health
Here are some examples of spatial analysis in the context of public health:
Disease Mapping with Location
Satellite data is finding increasing use in predicting disease risks across geographies. It can predict the spatial distribution of infections and help plan the medication distribution for control and preventive measures.
Geostatistical models are helpful, along with other factors like surface temperature and rainfall – these help in understanding the prevalence of disease in society. Annual temperatures and distance to water bodies are some other critical factors involved in the process.
One of our clients, the World Mosquito Program (WMP), alters mosquitos with natural bacteria to limit their capacity to transmit dangerous diseases. These mosquitoes’ progeny lose their capacity to transmit illness as well.

WMP collaborated with Gramener as part of a Microsoft AI for Good grant. Our AI-driven approach evaluates population density using satellite images and Geospatial AI. It suggests a neighborhood-level action to hasten social effect and save lives.
Gramener used computer vision models on high-resolution satellite pictures to estimate population density and sensitivity to mosquito-borne illnesses at the sub-neighborhood level. The AI solution creates a fine-grained release and monitoring strategy based on the city, population, and projected coverage. This allows the WMP team to move quickly and maximize the effectiveness of their solution.
Download Case Study: Find out how Gramener helped WMP save millions of lives by using spatial analysis for neighborhood-level public health intervention.
Sanitation & Hygiene Analysis
The spatial analysis example of geospatial models helps map the population’s access to water and sanitation services. The method involves the use of geo-referenced population data with other geospatial factors. It can help in identifying the disparity in access to water and sanitation facilities.
Researchers can also identify access to water, sewerage systems, open defecation, and other factors that contribute to sanitation. The data can help planning bodies in improving their inventions for the welfare of everyone.
Population Density Mapping for Vaccination
When we talk of the current COVID-19 pandemic, it is a global challenge. Vaccinating as many people as possible to achieve herd immunity status is critical to ending the pandemic. GIS technologies can help in optimizing vaccine distribution to reduce the period to vaccinate everyone eligible.
It is possible to map the population by identifying and segregating people based on their age groups and the type of vaccines available. Analysis can show the number of people living close to a vaccination site and the time taken to vaccinate them. It helps in the quick and efficient distribution of vaccines to enable uniform coverage across cities, states, and countries.
Health Facility Mapping
Healthcare facilities are a vital component of any health system. Healthcare access is critical for each individual living in a geographical area. Ensuring enough coverage of healthcare facilities is something that defines a successful healthcare program. Spatial analysis helps identify the locations of health facilities and their proximity to people.
GIS systems further help gain access to advanced metrics of healthcare and identify inequalities for better planning. The correct data helps in planning appropriate access of healthcare facilities to even the marginalized sections of society.
Spatial Analysis Examples in Smart Agriculture & Precision Farming
Here are some spatial analysis examples on the agriculture front:
Crop Yield Prediction
Reduced crop production has become a common phenomenon in recent years due to the unpredictability of climate. Weather forecasts today play a critical role in improving crop management. Crop yield prediction, through spatial analysis, helps in planning and executing smooth logistical operations.
It is possible to study crop yield prediction through satellite imagery, soil conditions, and climate data. Another crucial factor is the possibility of pest attacks in farms, which can also be predicted. These resources combine to help identify a suitable time for crop production.
Livestock Monitoring
Livestock is a vital element of the economy, making their management an essential task. At places where cattle roam around freely, spatial monitoring assumes much more importance. Studies have also shown that livestock can release methane, which has a direct impact on global warming. Larger herds can lead to higher methane emissions.
Nitrogen released in the soil is also hazardous as it can pollute water bodies as well. More importantly, the effect of different species like cattle, swine, and goats can differ. GIS tools enable online monitoring to check the damage caused to vegetation and landscape.
Another essential aspect is the manure production of animals, which is beneficial for biofuels. Quantitative modeling tools help in calculating biogas production through the number of livestock and the quality of manure. It assumes importance for countries where dependency is heavy on livestock and the natural gas resources are less.
Farm-Level Nutrient Analysis
Soil properties mapping is essential to adopt sustainable farming practices. GPS tools can help in identifying and collecting coordinates of sample areas. Researchers can then study the soil properties like pH level, nitrogen content, nutrient levels, and much more. A GIS environment can showcase the soil properties and their spatial variability. It is possible to do that with the help of geostatistical analysis and interpolation techniques.
The spatial dependency level and spatial distribution of soil properties can vary significantly. This data can help decision-makers to plan for better nutrient management. The prototype data also remains helpful for future use of fertilizers.
Crop Detection & Monitoring
The growth and productivity of crops depend on several factors like soil condition, weather, and other management techniques. These can differ significantly across regions. To enable smart farming, remote sensing data is ideal for mapping crops and understanding their performance.
A crop simulation model in the GIS framework can monitor crop performance through remote sensing techniques. The remote sensing data can also help identify information related to crop distribution, environment, and phenology.
Purpose of Spatial Analysis Solution
The spatial analysis examples and applications are far and wide. We take a look at four such applications in detail:
Simplify Geographic Search
As the first spatial analysis example, it involves researching geography to identify the buildings and other structures. For example, researchers might need to understand “how many hospitals are available in a particular town.” This nonspatial query does not require knowledge of the physical location of a hospital. However, if the question is “how many hospitals are within a distance of five kilometers with each other,” it becomes spatial.
GIS can help in measuring the distance between the hospitals. It becomes possible as a GIS can link spatial data with facts regarding geographical features on a map. The information remains stored as attributes and characteristics of graphical representation. The lack of GIS means that street networks will have simple street centerlines. It is not very beneficial from a visual representation point of view.
GIS gives you the chance to use different symbols and showcase the database on the map. You can show the building type like hospitals. The visual representation makes it easier for users to study information seamlessly.
Enable Population Clustering
The distribution of population has spatial features. Population analysis through traditional methods does not allow combining quantity, quality, data, and graphic methods. GIS helps in exhibiting the spatial characteristics of population data on a macro level. The technology leverages display and analysis functions to enable comprehensive representation.
The micro-level representation of population data involves adding public institutions, retail units, and other structures that make up a geographic area. Such models also showcase the effect of such structures on a population. GIS helps the decision-making authorities by integrating population and spatial data. Population clustering remains a prominent spatial analysis example.
Offer Ease of Data annotation for Insights
The third spatial analysis example is data annotation or exploratory insights, which involves using tools and methods that uncover finer details of data. It also includes spatial and nonspatial patterns and distributions. The raw data usually comes in tabular form, and making sense out of that set can be difficult.
Exploratory analysis works with numeric data to identify the mean value. Some other statistics involved in the process are median, standard deviation, and visualizations. Scatter plots and bar charts are part of visualizations. Insights help in exploring spatial patterns and performing spatial analysis.
Enable Visual Mapping with Layers
This spatial analysis example is critical in visualizing information. Geospatial analysis tools help in performing the visual mapping. Users can analyze data sets by adding them to maps. The layers remain on background maps and can have charts, heatmap, line layers, and geodata. You can use internal and external sources to gather data for layers and background maps.
Visual mapping involves gathering data from sources like smartphones, satellites, vehicles, and wearable devices. These can power your analytics and dashboard reporting to improve the decision-making process. You can also identify patterns and get insights that do not appear in raw data available in spreadsheets.
Bottomline
Spatial analysis has assumed an essential role across industries today. Researchers and planners across governmental and non-governmental agencies use spatial algorithms to study patterns across geographies and plan their interventions. The backing of data also gives assurance regarding the successful implementation of programs.
In the case of welfare programs of non-governmental organizations, it becomes much more critical. It helps them spend their finances wisely to ensure maximum people get benefit from their programs.
At Gramener, spatial analysis solutions are one of our key offerings. We help you leverage satellite imagery and related information to solve your business challenges.
Contact us for custom built low code data and AI solutions for your business challenges and check out spatial analytics solutions built for our clients, including Fortune 500 companies. Book a free demo right now.