

Apple started publishing mobility trends for data enthusiasts and healthcare experts to find insights around navigation habits of people amidst COVID-19 lockdown.
The data takes 13 Jan as the benchmark for navigation habits and all the numbers for subsequent dates indicate percentage increase or decrease over 13 Jan.

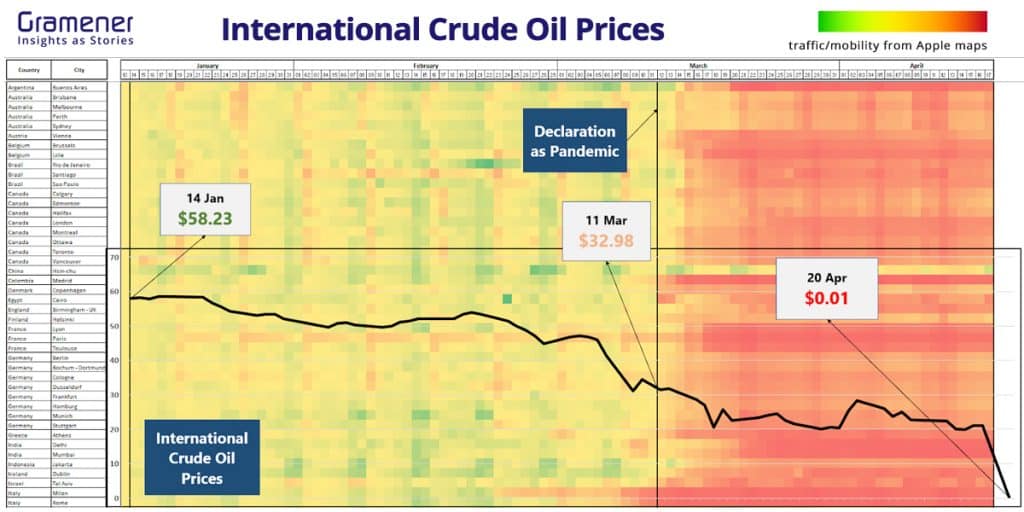
Greens Indicate Traffic higher than 13th Jan, Reds Indicate Traffic lower than 13th Jan
Tools Used to do mobility analysis
- Microsoft Excel for analysis.
- Microsoft PowerPoint for annotations.
Insights on mobility during COVID-19 lockdown
Here are a few interesting Insights:
- Almost all the countries have locked themselves down after WHO’s declaration of COVID-19, a global Pandemic. And, obviously, the traffic goes down in major cities.

The green patches in the no lockdown period indicate increased mobility on Saturdays and Sundays
2. There are a few countries such as China, Japan, Taiwan, and Russia that continued to allow people to move freely after WHO’s declaration.

3. There were a few countries such as South Korea, France and Italy that have enforced lockdown, long before WHO’s advisory.

4. Mobility analysis illustrates that COVID-19 lockdown at various places is not 100% effective. The fact that we can still see dark patches on Sundays mean people are commuting (for work?) on weekdays. Can we attribute all this traffic to people purchasing essentials?

5. Lockdown in India is fairly successful based on the mobility data from Mumbai and Delhi. There’s gradual decrease in mobility after the lockdown.

6. There was abnormally high traffic (~200%) in Cairo on 24th Feb (a Monday.) We looked up the news – It was reported that there were heavy thunderstorms and thousands were stranded on roads (even an Egyptian Premier League game was called off). This might have led to people searching for alternate navigation routes that increased the traffic.

Bonus: Crude Oil Prices went down by 99.98% during this period!
Download the source excel file on which the conditional formatting is applied to explore insights yourself.
Check out the insights on the huge drop in electricity demand during the 9-min lights out campaign in India.
Here are a few more data stories on Covid19.
If you have any other interesting Hypotheses, do comment.
Vamsi, It is interesting to note on 3rd insights that these countries were badly hit though they were early movers in the lockdown. I wonder if it is contradicting to the current logic of distancing.