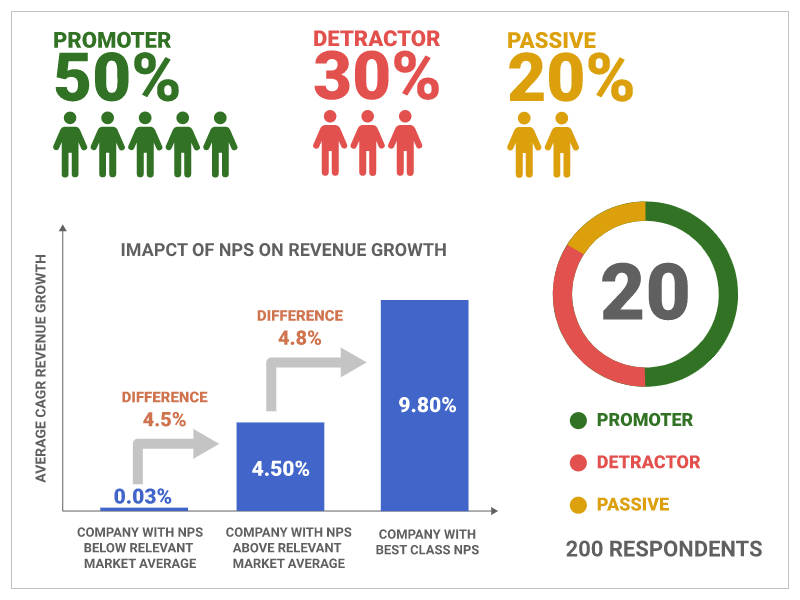
Net promoter score, also known as NPS, is a crucial metric in customer experience programs. It evaluates how likely it is for customers to refer others to your organization for individual products and services. In other words, if you know how to calculate NPS you can measure and improve customer satisfaction scores.
You can calculate Net promoter score (NPS) by subtracting the percentage of individuals who wouldn’t recommend you from the percentage of individuals who might do so. Bain and Company introduced NPS first in 2004. Since then, many organizations use it to measure and track how their clients see them. NPS can help you quantify ROI for your CX Spends and help you understand where to invest more.
NPS quantifies the loyalty of customers to an organization. This metric is critical as faithful customers drive development by making references which would invariably lead to new customers. In this way, the higher your net promoter score is, the likelier it is that your organization is achieving significant growth.
- NPS Formula and How to Calculate Net Promoter Score?
- What is a Good Net Promoter Score?
- Step By Step Process to Do NPS Survey
- How to Calculate Net Promote Score in MS Excel
- Calculate Net Promoter Score with Free Web NPS Tools
- Calculate NPS with Machine Learning Models
- Types of NPS Surveys
- Some Possible NPS Questions to Ask
- Learn More About Customer Experience Analytics
NPS Formula and How to Calculate Net Promoter Score?
To calculate the net promoter score, you need to send a survey to the customer. The intent of the NPS survey is to request your client to rate the likelihood of recommending your company’s products or services on a scale of 1-10.

- Respondents who provide a score of 0-6 are called detractors.
- Those who respond with 7 and 8 are called passives.
- Whereas, those who respond with 9 and 10 are called promoters.
Let’s take a more in-depth look at these terminologies.
Detractors
These sets of people can be referred to as “unsatisfied customers” who are likely to churn, criticize, leave negative feedback and recommend against such a company.
Passives
Passives are satisfied customers who show some sort of apathy towards the company’s offerings. You can say that they have neutral feelings about your products and services.
Promoters
Promoters are faithful, loyal, and committed customers who delight in purchasing goods from the company and referring them to others. These are the set of people every company wishes to work with.
Now that we have discussed these terms let’s look at the mathematical formula used to get the NPS. You can calculate NPS by subtracting the percentage of detractors from the percentage of promoters.
In mathematical terms,
Net Promoter Score = (Number of Scores by promoters/Total Number of Respondents) – (Number of Scores by detractors/Total Number of Respondents)

or we can simply say,
Net promoter score = %Promoters – %Detractors
Now for a quick example, ‘Company X’ sent out surveys to customers in a bid to calculate their NPS. After taking all the responses, the company recorded 40% promoters, 10% detractors, and 50% passives. Hence the NPS score turns out to be 40% – 10% = 30%, and we have the score as 30.
What is a Good Net Promoter Score?
With the NPS index ranging from -100 to +100, 30 can be seen as a satisfactory score, and 50 as a superb score. A score of 80 is world-class, denoting the presence of far more promoters than detractors. A negative index would be quite the opposite as that would signify more detractors than promoters.
Step By Step Process to Do NPS Survey
Below is a step-by-step guide on how to go about the net promoter survey calculation process.
Step 1: Send Survey Questions to Clients
This is the first step to make in trying to execute an NPS calculation. Customers have to answer the question: “How likely is it that you would recommend our company’s product/service to a friend or colleague?”
They are to select an answer on a scale of 0-10, where 0 means “would definitely not recommend”, while 10 indicates “Would definitely recommend”.
It is also highly advisable to attach a blank field to the scale where customers can further explain their rating choice and describe their experiences. You can then analyze customers’ written responses and work on the feedback to improve the NPS, customer service, and satisfaction.
Step 2: Categorize the Responses
After collecting the answers to the question shared with all the customers, they have to be categorized into the three classes we discussed earlier: Detractors (score between 0-6), Passives (score of 7 or 8), and the Promoters (score of 9 or 10).
Step 3: Get the Percentage of Promoters and Detractors
Since the NPS calculation involves just the promoters and detractors, we need to get the percentage of each class involved. We can achieve this by dividing the number of the chosen class by the total response recorded. For example, if 100 responses were recorded with 40 individuals giving promoter scores and 10 individuals giving detractor scores, then the percentage of promoters and detractors would be 40% (40/100) and 10% (10/100), respectively.
Step 4: Apply NPS Formula
Now it’s time to apply the NPS formula! Let’s go back to the previous example.
NPS = % promoters – % detractors = 40% – 10% = 30 ,which means the NPS would be 30.
How to Calculate Net Promote Score in MS Excel
There are several methods to calculate NPS, and one of these ways involves using Microsoft Excel (spreadsheet). To begin, we have to follow the step-by-step guide discussed earlier. After sending out the responses and recording them, the raw data consists of rows of numbers ranging from 0-10. You need to classify it into detractors, promoters, and passives.
i) Sum all the promoters – those who scored 9 and 10
ii) Sum all the detractors – those with responses 0 to 6
iii) To calculate the percentage of promoters, divide the number of promoters by the total number of responses. You can follow the same process for detractors
iv) Apply the NPS formula and substract the percentage of detractors from percentage of promoters
Calculate Net Promoter Score with Free Web NPS Tools
This is another popular and quick way of performing an NPS calculation. All you need to do is send out the surveys to extract customers’ responses. Then, input these scores into an online NPS calculator platform to get the grouped answers automatically. This method is quite different and much easier than the manual NPS calculation.
Delighted is an excellent example of Net Promoter Score calculators. The platform allows you to input the number of responses for each rating score and then group the responses and provide the NPS.
Hotjar is another splendid platform similar to the previous one and performs precisely the same function.
NPS Calculator is another amazing tool that receives input from customers’ scores and classifies the total responses to calculate the NPS.
Calculate NPS with Machine Learning Models
Metrics like NPS are useful in understanding customers’ sentiments. It is not enough to just depend on the scores without considering the sentiments behind it. Some detractors can still talk positively about some aspects of the service they receive. Promoters can still point out features they dislike even though they love the product or service, which calls for a proper sentiment and satisfaction analysis.
Calculate NPS with Gramener’s ML-Driven Solution
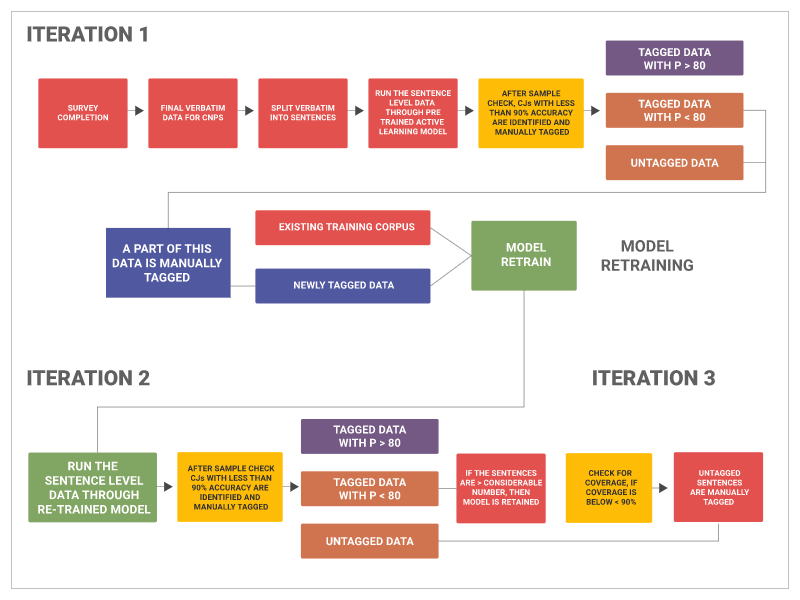
Gramener’s NPS analytics solution can identify NPS with its ML-driven NPS solution architecture with an accuracy of 84% and improve NPS and customer behavior with sentiment & satisfaction analysis.
To produce meaningful information, Gramener’s NPS analytics extracts data from surveys containing the satisfaction scores. It then proceeds to cleanse the data to focus only on the survey questions that drive customer satisfaction.
We use Text analytics (Natural Language Processing) and Sentiment Analysis to impact the Net Promoter Score across the customer journey stages.
Then, we integrate the cleaned-up data with visual analytics applications to derive hidden insights. We use different types of data visualizations from our repository to show insightful trends. The trends and data stories help customer experience managers to derive decisions to improve customer satisfaction scores. The customer sentiment analysis is an excellent technique to figure out Net Promoter Score (NPS).
Types of NPS Surveys
Transactional Net Promoter Score ( t-NPS)
Transactional surveys are usually carried out after customers make certain business transactions, and this survey aims to get the customer’s opinion and sentiment. For instance, these types of surveys occur as soon as a customer makes a purchase, or after a major product update, or after customer care resolves an issue.
Transactional NPS is great for understanding a particular aspect of your business. Transactional surveys measure customers’ satisfaction after their recent interaction with products or services. Since the customer’s feedback ties directly to that product or service, it’s easy to notice and tackle any defects or faults that might occur.
Relationship Net Promoter Score (r-NPS)
Don’t send out relationship surveys randomly but periodically, like every quarter or bi-annually. These surveys help understand customers’ needs from time to time and measure their satisfaction which would promote the customer and the brand’s long-term relationship. Such surveys are ideal for generating feedback on the strength of the working relationships with the customers.
These surveys are essential as it helps in assessing customers loyalty.
Some Possible NPS Questions to Ask
An NPS survey is a single-question survey, and organizations should appropriately write this to fetch the required response. The company should keep the survey to a maximum of four or five questions to avoid survey fatigue. In as much as you are trying to know how likely a customer would recommend your products or services, it can also be useful to ask them some questions to improve their experience. These questions include:
- How easy was it to seek out the products you were looking for?
- What made you purchase from us today
- How easy were the subsequent parts of your journey?
Requesting customer feedback is an ethical practice. And it is even important to ask for the reason behind the Customer Satisfaction score the clients assign. The easiest way to find customers’ reasons for a particular score is to ask them to identify only the most important reasons for their score and then present them with a predefined list of touchpoints.
After receiving the most important reasons, it discourages lengthy surveys and the complicated statistical approaches needed to understand the data. Also, how you ask customers why their score should be different for promoters, detractors, and passives should be different.
Learn More About Customer Experience Analytics
- Check out our ultimate Net Promoter Score (NPS) guide
- Know what are the best SaaS customer retention strategies to Improve Customer Experience
- Know what is Churn Analysis and how to retain customers [Telecom Case Study Inside]
- Listen to a podcast with IBM on improving customer journey with customer intelligence
- Know what your customer is speaking via social media sentiment analysis


