Gramener has once again demonstrated its #DataJournalism credentials by assisting Republic TV in creating simple and insightful data stories around Gujarat and Himachal Pradesh assembly election results. The whole project from ideation to execution was done in a 3 week period. A 10 member team consisting of designer, developers and testers worked in a agile fashion building visual storyboards, iterating on them based on input and making them ready for primetime.
We thank Arnab & the Republic team for the opportunity & making this a successful collaboration.

TV Analysts had this to say about Gramener’s Election visuals;
“Your graphics and election data management were simply super on screen, compliments”
“Your storyboards have taken Visual quality one notch above the rest”
The data stories were narrated using the below 3 Visual Storyboards. Source data was the data published by Election Commission of India.
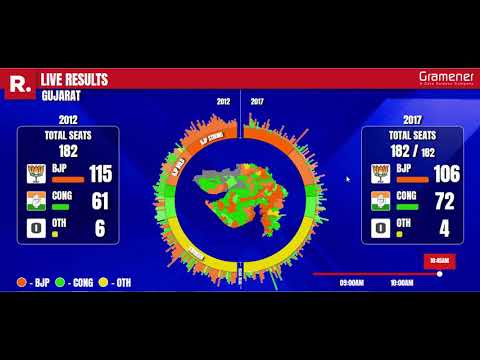
COMPASS – This storyboard gives a comparison of constituency level result between 2012 and 2017. The visual comparison is also represented over a map of each state using a color code – Orange for BJP, Green for Congress and Yellow for OTHER parties. All assembly constituencies were broken down into BJP Strong, Congress Strong, BJP mild, Congress mild and Swinger. If a party won the last 3 assembly election in a constituency, it was grouped under Strong. If a party won 2 consecutive assembly elections of last 3 assembly elections, the constituency was grouped as Mild. All constituencies that are not Strong or Mild will fall under Swinger.
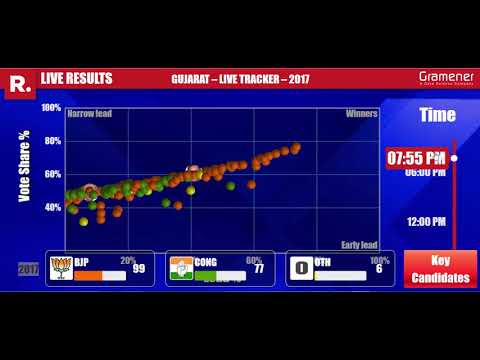
Live Tracker – This is a real time tracker would plot the performance of the leading candidate in each constituency on a Voter share %(Y axis) vs Lead % (X axis). Each constituency is represented by a bubble and the color of the bubble indicates the party that has the lead. Click on each bubble would show an overlay display the top 3 candidates in the constituency with Name, party they represent and the count of votes they received.
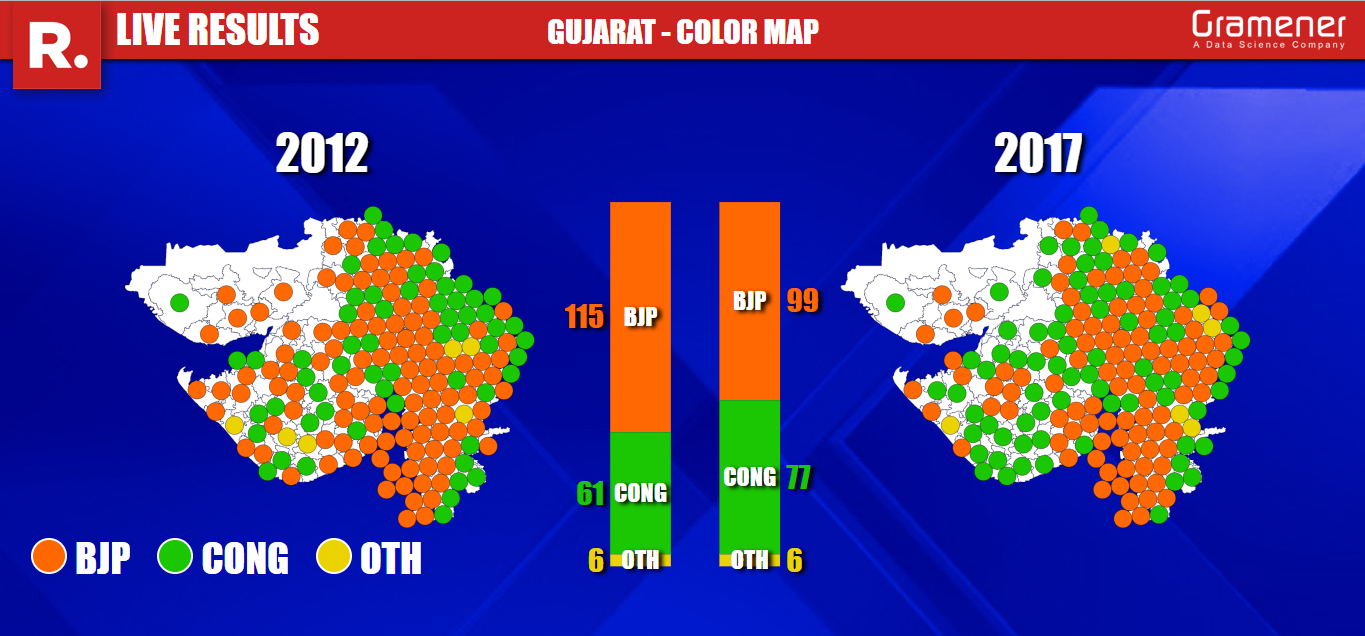
Color Map – This storyboard plots each of the constituencies as a bubble over the map of state. The color of the bubble indicates the party that has the lead. The comparative view of 2012 and 2017 shows the swing of electoral fortunes in each state.
Post analysis of election results point to an interesting fact. None Of The Above (NOTA) option ranked #3 in 115/182 constituencies in Gujarat state. In 30 constituencies the count of NOTA votes exceeded the victory margin of the winner. Interesting enough BJP won 15 of the 30 constituencies with INC winning 13 and Independents winning the remaining 2.
For glimpse of Gramener’s storyboards in action on Republic TV please look at video below.