The Election season in India is live again with the 17th Lok Sabha elections. The world’s largest democracy is voting for Phase 1. But, do you know who you are voting for? The following story is processed on the general elections 2019 data analysis (phase 1) and 2004, 2009, 2014, general elections data.
Insights from General Elections 2019 Data Analysis – Phase 1
Know Your Candidates: The richest and the independents
Here are a few insights we came across during our analysis.
- 1266 candidates are contesting in the 91 constituencies for phase 1.
- Telangana has the highest density of candidates with 25.8 candidates per seat.
- Nizamabad in Telangana has a whopping 183 candidates contesting with 177 contesting as Independents. In 2014, Telangana Rashtra Samithi (TRS) party won in Nizamabad with a massive margin of 17%.
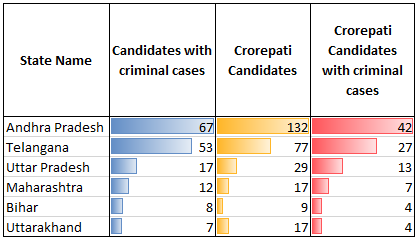
- 31.7% (401) candidates are Crorepati and 16.8% (213) have criminal cases against them
- Andhra Pradesh has the highest number of Crorepati candidates. It also has candidates with highest criminal cases. Here, take a look at the rest of the phase 1 contestants.

Party Strongholds
Let’s talk about party strongholds this election season.
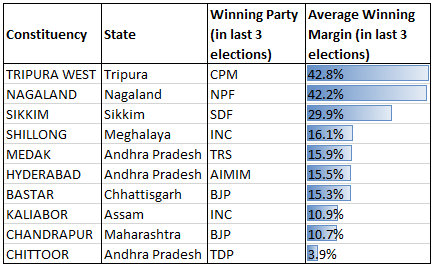
- 10 constituencies out of 91 are where a single party has won since the last 3 Lok Sabha Elections.
- The top 4 seats in the list belong to the North Eastern regions of India.

Insights from past 3 General Election Data Analysis
Let’s see how the voters chose the Members of Parliament (MPs) in the past 3 election seasons.
We scrapped the candidates’ information from myneta.info. The data is backed with affidavits submitted to the Election Commission for the Lok Sabha elections of 2004, 2009 and 2014.
We project the candidates and winners WRT their education, wealth, and gender.
Education Levels of Candidates
Yes, the country elected candidates with fair educational background.
- Graduates and Post Graduates take a little over 1/3rd of the total candidates (35%).
- 14% candidates are 10th pass.

Education Levels of elected MPs
Well done, voters.
- The highest proportion of elected MPs were Post Graduates.
- 70% of all elected MPs were either Graduate Professionals, Graduates or Post Graduates.

Conversion Success Rate
- Graduate Professionals followed by Doctorates had the highest conversion rate. A conversion rate is the ratio of win to tickets.
- Graduate candidates or less had a low conversion rate (less than 10%).

Candidates per Lok Sabha seats
- Haryana had the highest average number of candidates (19.5) contesting per seat.
- Second was NCT of Delhi (18.5) followed by Chandigarh (15.6) and Telangana (15.6)
- The North Eastern states on an average has 10 or less candidates contesting per seat


States/UTs with richest contesting candidates
- The smaller states/UTs (<5 seats) have had richer candidates contesting.
- Among larger states (>=10 seats), Telangana has the richest candidates.

Parties with highest success rate
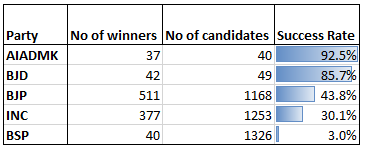
State parties have the highest success rate compare to National political parties.
- AIADMK has the highest success rate of 92% winning (37 seats out of 40).
- Second is BJD with 85% success rate (42 out of 49 seats).
- BJP has a success rate of 44%.
- INC has a success rate of 30%.
- BSP has the highest number of candidates (1326) with a low success rate of 3%.

Women in Elections
- BJP is the major National party with the highest success rate of 50% of its women candidates.
- Second is INC with 28% women candidates.
- While the number of women contesting as Independents is still the highest (451).
- Sadly, in the last 3 elections, no woman candidate has won as an independent candidate.

Wealth in Elections
The success rate of Crorepati candidates is higher.
- The number of Crorepati candidates contesting elections increased from 12.4% (in 2004) to 27.3% (in 2014).
- The proportion of Crorepati MPs has also gone up from 30% in 2004 to 82% in 2014.

- Also, the maximum number of Crorepati candidates were from INC followed by BJP.
BSP, SP and AAP are the other parties in the list of top 5, fielding the maximum number of wealthy candidates.
We hope these insights helped you compare the ongoing elections with the previous ones. How did you like our analysis and story? Do let us know. If you have any more insights to add, we welcome your opinions.
Note: Rhitamjeet Saharia, Associate Analyst at Gramener did the data analysis and provided the insights for this story.

