Yesterday, we kicked off the CNN-IBN Microsoft Analytics centre, a website visually analysing the historical and upcoming Indian elections. It’s hosted at ibnlive.in.com/general-elections-2014/analytics/ as well as at bing.com/elections (not to mention Gramener’s own gramener.com/election/). You’ll also see this on CNN-IBN’s news channels regularly over the next few weeks.
It aims to make the past 15 Lok Sabha elections more easily understandable for the lay audience, allowing them to explore and discover insights. This is also a learning experience for us at CNN-IBN, Microsoft and Gramener, while allowing us to share the insights we find.
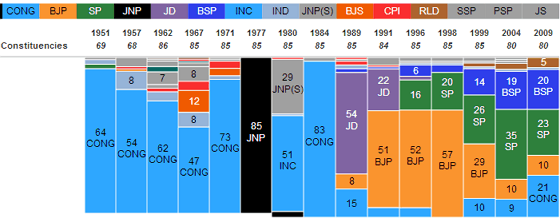
For example, we find that only once in the history of Uttar Pradesh has a party swept every single seat in the state – the Janata National Party in 1977. This has never happened in the history of any large state.
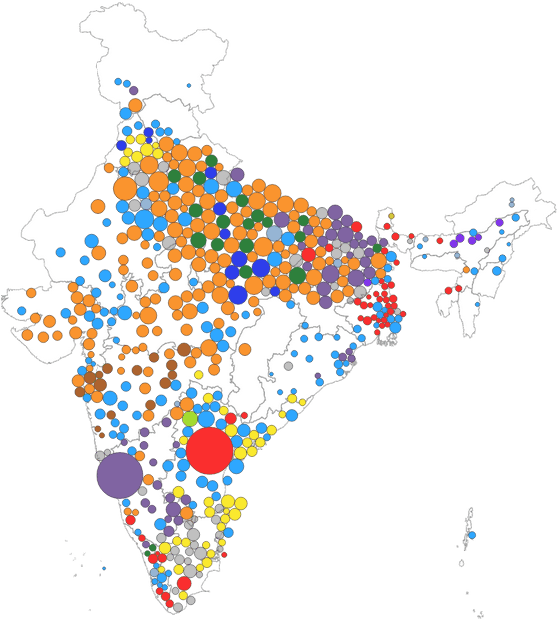
Or, for example, the curious case of Nalgonda and Belgaum in the 1996 elections, where both constituencies had over 450 candidates standing for elections (independents, mostly), with many of them receiving no more than a hundred votes, perhaps from friends and family.
Each constituency is shown as a circle. The colour represents the party that won in the 1996. The size is based on the number of candidates. You can clearly see the large purple circle – where JD won in Belgaum and the large red circle – where CPI won Nalgonda.
Over the next few weeks, we hope to add more insights to these visuals, and blog about them as well. You’ll see some of these on TV on CNN-IBN. In the meantime, please feel free to explore!


This is indeed a good demographic, i wonder how much it will change in the coming election.