CIHL (a consortium of universities in Andhra Pradesh) offers a masters course in information technology. As part of that, the computer usage for volunteering student was tracked for 7 weeks. The raw data shows how long each application was used.
We visualised the total usage of the top applications by student.
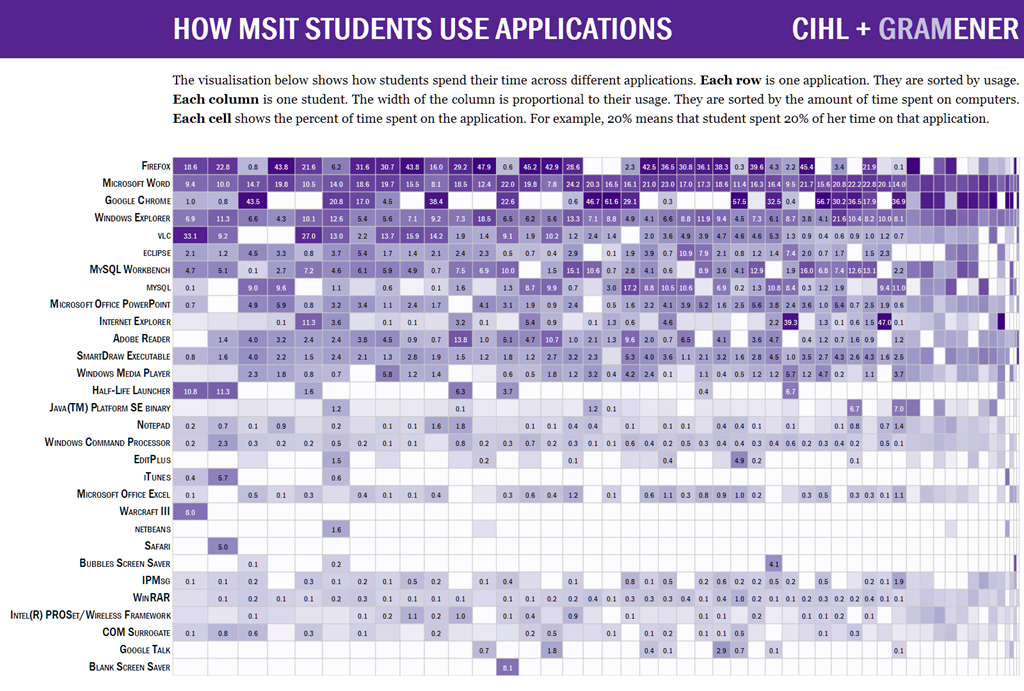
Before we go on to the results, a few words about the visualisation.
This is similar to the heatgrid we saw last month, but with a difference – the widths of the columns are not constant, and represent the hours of usage. This means that the colour represents not just the % usage by a student – it has an additional significance. The amount of purple ink used in each row is the total hours of usage of the application.
Now for what we found.
Browsers are clearly the most popular application, with people spending 25-50% of their time on the browser. Firefox is the most popular browser, followed by Chrome. Only 3 students used IE as their main browser.
Microsoft Word emerged as the second most popular application. This is what students submitted their assignments in.
VLC was the next most popular, ignoring the time spent on Windows Explorer. While their coursework did require them to view a number of videos, an analysis of the window titles showed that the percentage of course-related videos were in a minority. This also provided us with a number of interesting movie recommendations that has kept us busy last month.
Two games made their way into the top applications list: Half Life and Warcraft III. While only 4 students were serious gamers, the time they spent on this was significant. The student spending maximum time on the PC spent almost 20% of time on games, with another 30% on movies. (We were yet to investigate whether this had a positive or negative effect on grades.)
Chat applications did not show significant usage. IPMsg was the most popular, with up to 0.5% of time being spent on this. Google talk was used by fewer people, but those that used it spent up to 3% of time on it.
But the strangest observation was regarding two students, both of who spent about 10% of their time looking at screen savers. One of them was, in fact, a blank screen saver. We have still not been able to figure out what exactly they were up to.
The emergence of Generative AI (GenAI) is reshaping healthcare use cases and facilitating the rapid… Read More
The U.S. Food and Drug Administration's (FDA) stance on GenAI is clear: it's a groundbreaking… Read More
Executive Summary In healthcare, protecting patient information is not just a legal requirement; it's a… Read More
Demand forecasting in the supply chain is crucial for optimizing inventory levels and ensuring efficient… Read More
Hi, I am ChatGPT 3.5 Turbo. Do you know what my favorite number is? Do… Read More
After a successful webinar on digital transformation and sustainability, we organized a sequel titled “Data-Driven… Read More
This website uses cookies.
Leave a Comment