You can learn a lot about a city by the kind of activity it displays. In our case, we were interested in when a city wakes up – virtually.
Using data from a leading internet service provider, we looked at the time at which people log on to the Internet.
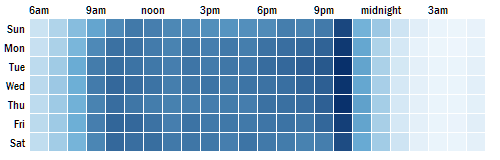
That’s the average browsing behaviour in 2011 across India. The darker blue indicate more people browsing online at that time. Most people seem to be browsing at 10pm (remember: this is primarily a domestic ISP), and there doesn’t seem to be a huge difference between the days, except that people wake up slightly later and sleep slightly later on Sundays.
However, between cities, there is a considerable variation in this pattern. Let’s compare Bangalore and Mumbai, for example.
The red areas indicate times when Bangalore-ans browse more, and blue areas indicate times when Mumbai-ites browse more. Folks from Bangalore are relatively early risers, starting as early as 4am on most days, and retain the lead until around 10am, when the Mumbai usage catches up. Mumbai leads in the afternoon, while Bangalore recaptures the lead a bit after 6pm. Most Bangalore-ans are asleep by 11pm, though, and Mumbai-ites zoom past, capturing the lion’s share of browsing between 11pm and 4am at night.
Also, it appears that Mumbai-ites work a lot less than Bangalore-ans on Sundays – opting to go online only after 9pm at night.
On the whole, “work-hard, play-hard” might capture the spirit of Mumbai-ites, while “early-to-rise” seems to define Bangalore. (From personal experience, we find that a bit hard to digest, but the data is irrefutable.)
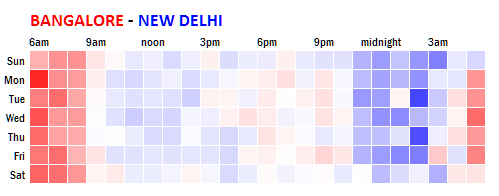
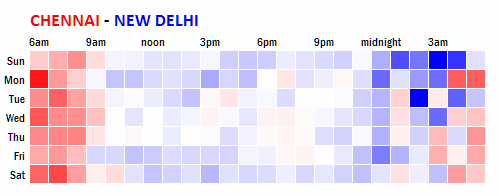
A comparison with New Delhi shows a somewhat similar profile through the hours of the day, but the weekday behaviour is similar. So Bangalore does rise earlier and sleep earlier than New Delhi, but works about the same on weekdays and weekends.
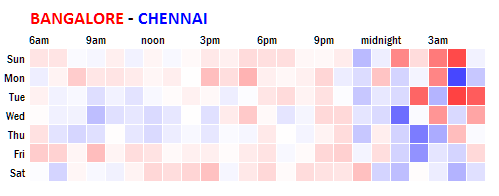
In contrast, Bangalore and Chennai seem to have quite a similar browsing profile through the day. However, on weekends, Chennai seems to browse a lot less than Bangalore, thus qualifying as “early-to-rise”, and also for “relax-on-weekends”. (From personal experience, we find that quite believable.)
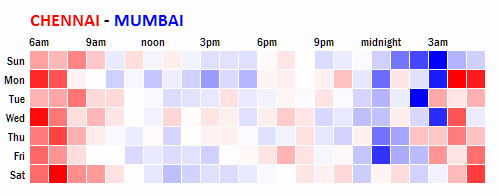
If we take Chennai and compare that with Mumbai or Delhi…
… the profiles are quite similar. As before, both cities wake up and sleep late. Mumbai is a bit more active on weekends than Delhi.
Just based on this data, if we summarise our experience, this is what it appears to be:
| City Behaviour | Rises early | Rises late |
|---|---|---|
| Works on weekends | Bangalore | Mumbai |
| Takes weekends off | Chennai | New Delhi |
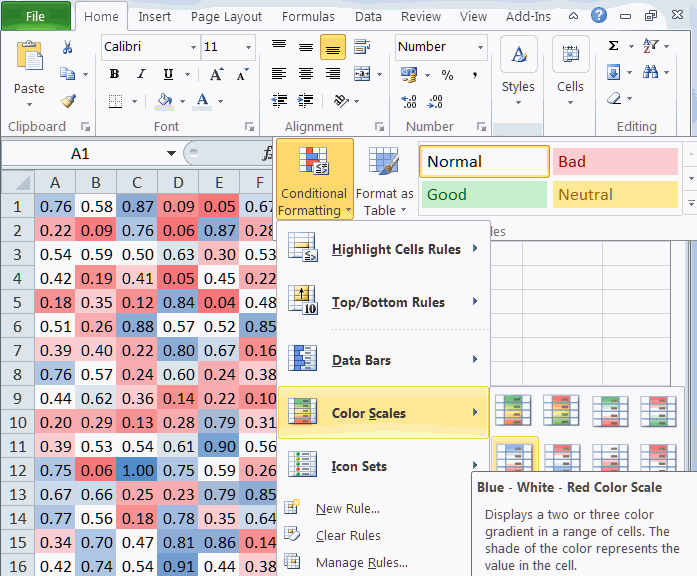
The visualisation we used above is a heat-grid. It’s analogous to scatter plots, but for discrete data instead of continuous data. Some of the situations where we’ve used heat-grids include:
… and so on.
If you’re interested in creating heat-grids yourself, you will find it fairly easy to do on Excel 2007 and beyond. Just fill in the values you want in, select them, and choose Conditional Formatting – Color Scales.
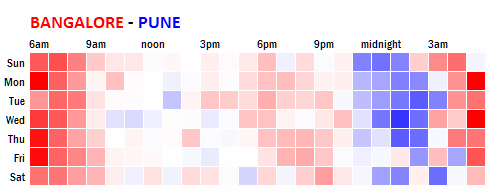
Update: We got requests to add a few cities – Hyderabad in particular. I’m afraid that this ISP does not have a strong presence in Hyderabad, so data is sparse. But here’s Pune:
As you can see, Pune seems to be a late riser. Probably not too different from Mumbai…
… and other than checking mails a bit earlier than Mumbai-ites on Sunday night, it’s pretty much the same pattern!
The emergence of Generative AI (GenAI) is reshaping healthcare use cases and facilitating the rapid… Read More
The U.S. Food and Drug Administration's (FDA) stance on GenAI is clear: it's a groundbreaking… Read More
Executive Summary In healthcare, protecting patient information is not just a legal requirement; it's a… Read More
Demand forecasting in the supply chain is crucial for optimizing inventory levels and ensuring efficient… Read More
Hi, I am ChatGPT 3.5 Turbo. Do you know what my favorite number is? Do… Read More
After a successful webinar on digital transformation and sustainability, we organized a sequel titled “Data-Driven… Read More
This website uses cookies.
Leave a Comment