This is a guest post by Nirav Chadda
Amidst the FIFA world cup fever, a few visual designers got together to celebrate it in a different way and met at Gramener. We explored the past, studied the trends and predicted the future. Each did it in their own amazing styles.
I tried to visualize a layout which had two views namely:
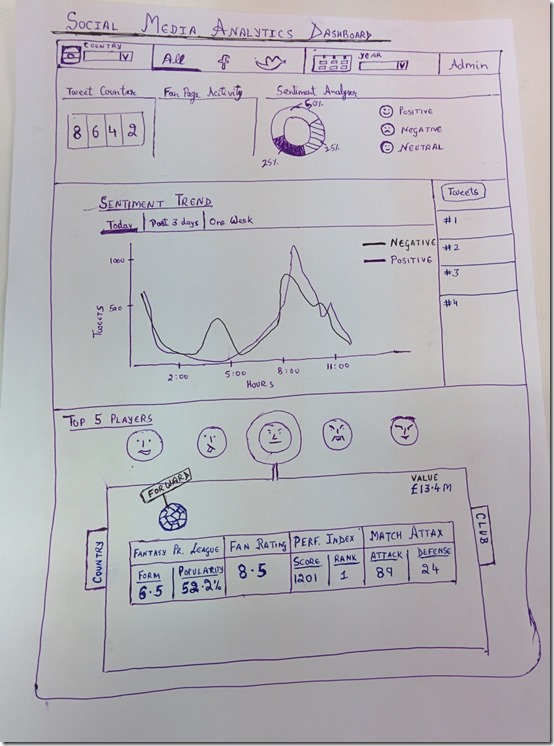
Social Media Analytics Dashboard: In here, I have tried my best to analyse all the available social media data and show it to the user in as simple a form as possible.
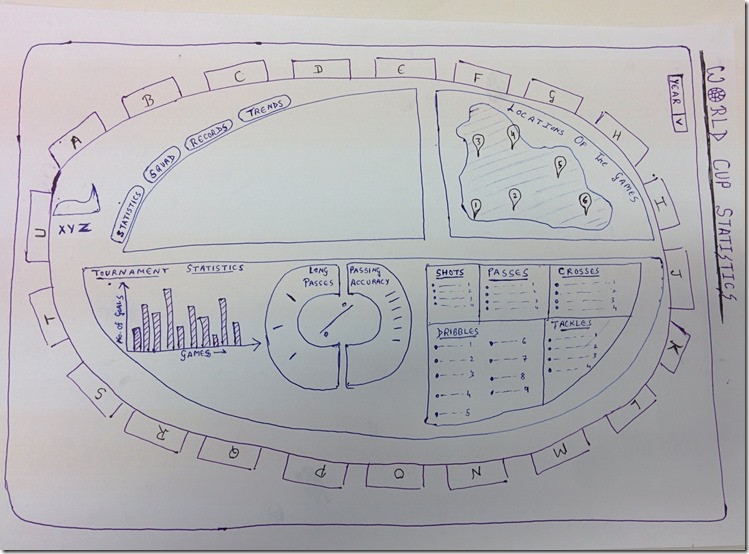
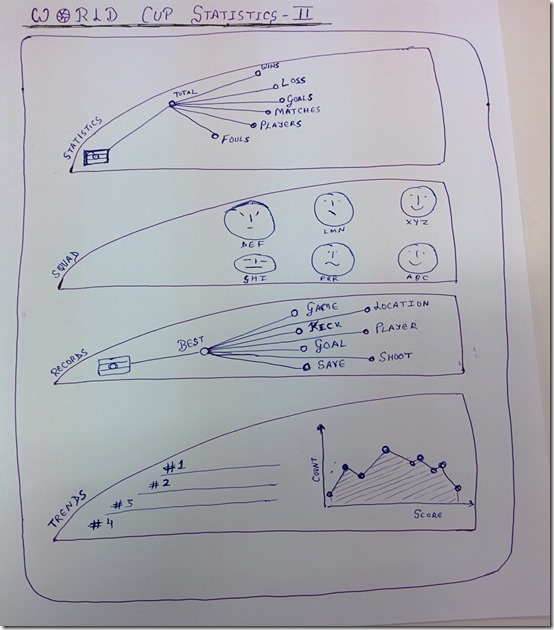
World Cup Statistics Dashboard: Here I aim to just use one filter, i.e. year, and show all the past statistics for every country in shape of a football field.
The aim of both these dashboards is to look at the trends or stats at a place and at a go,in a very user friendly way.


