Now that ADR’s tabulated analysed affidavits for all 543 constituencies, let’s see where the rich candidates live. On measure is to look at the number of crorepati candidates.
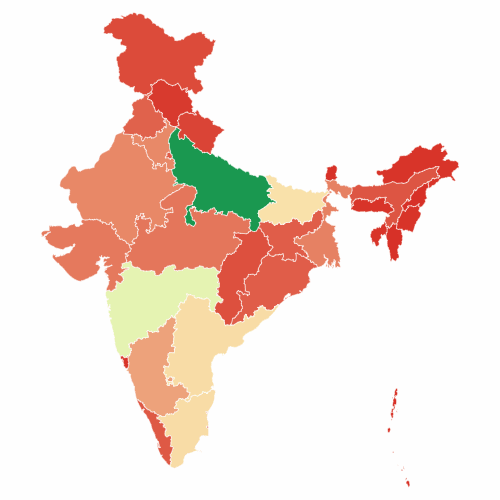
Uttar Pradesh, with over 400 crorepati candidates, tops the list. However, it also tops the list of number of candidates with over 1,250. The nearest competition is from Maharashtra with under 900 candidates.
Perhaps percentage of crorepati candidates is a better metric.
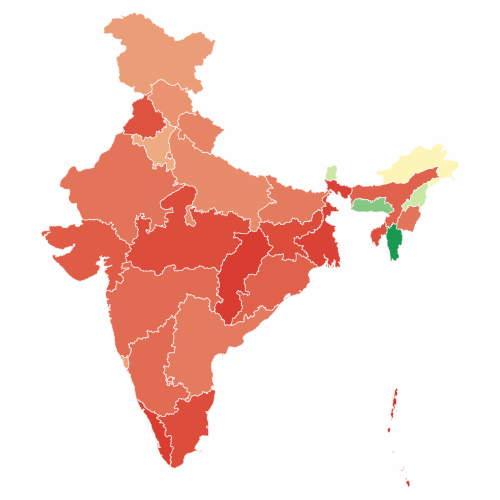
At this point, the picture dramatically changes. The Northeastern states have the largest percentage of crorepati candidates. In fact, you may notice that these are precisely the same states that had no candidates with criminal records. Of the 51 candidates standing for elections in Arunachal Pradesh, Manipur, Meghala, Mizoram, Nagaland and Sikkim, 28 candidates (more than half) are crorepatis. In Uttar Pradesh, it is less than a third.
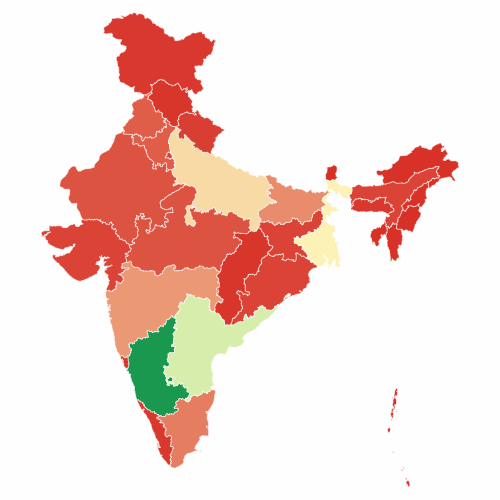
If we look at the total assets of candidates by state, Karnataka surges to the top. This, of course, is the Nandan Nilekani effect.
(However, if we take the average assets of each candidate, Meghalaya is comparable to Karnataka, with average assets of 21.6 crores per candidate – against Karnataka’s 21.7 crores per candidate.)
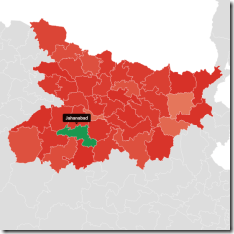
While Karnataka is a well known example of a single candidate / constituency pulling the state up, it is not the only such. Bihar is another such instance. Anil Kumar Sharma of JDU, the second richest with around Rs 850 crores of net assets, contests from Jahanabad, Bihar.
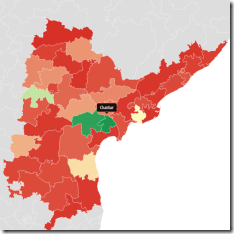
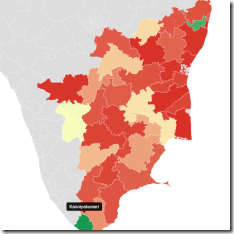
Other states have less glaring a contrast. Andhra Pradesh and Tamil Nadu have at 2 constituencies that have comparable average wealth. Guntur in AP has the wealthiest candidates, thanks mainly due to TDP’s Jayadev Galla’s Rs 680 crores, but neighbouring Narasaraopet comes close with Ayodhya Rami Reddy Alla’s Rs 650 crores. In Tamil Nadu, Congress’ Vasantha Kumar’s Rs 290 crores at Kanniyakumari pulls up the average, but Sriperumbadur comes close because of two candidates – DMK’s Jagathrakshakan and ADMK’s Ramachandran, with ~Rs 80 and Rs 90 crores.
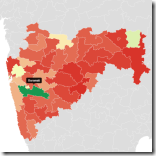
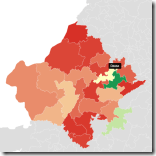
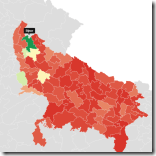
Maharashtra, Rajasthan and Uttar Pradesh, also have a a number of constituencies that are at least comparable to the constituency with the richest candidates.
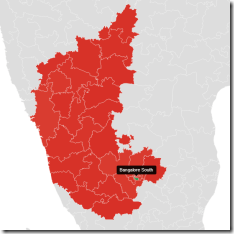
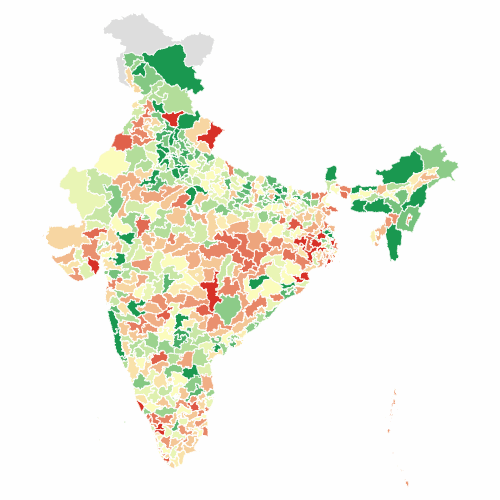
We’ll leave you with a map showing the percentage of crorepati candidates across all constituencies, just so you know where the wealth lies.
Really interesting and insightful analysis. +1 for that!
One question on a slightly technical front is how do you create such neat geographic heatmaps? What software do you use?
Thanks,
Shreyes
We built the software, Shreyas. That’s what we sell — a data visualisation server.