At Gramener we created a few templates that could show the performance of various channel packages offered by media companies — satellite TV companies for example.
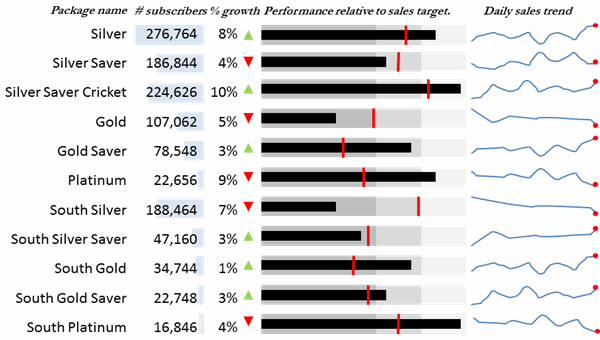
This view shows the performance of packages relative to their sales target. It is a combination of bullet charts and spark lines. The thin black bar indicates the actual sales this month. The red vertical line indicates the target. The shades of grey show good, average or poor relative performance.
The South Silver package clearly calls for attention.
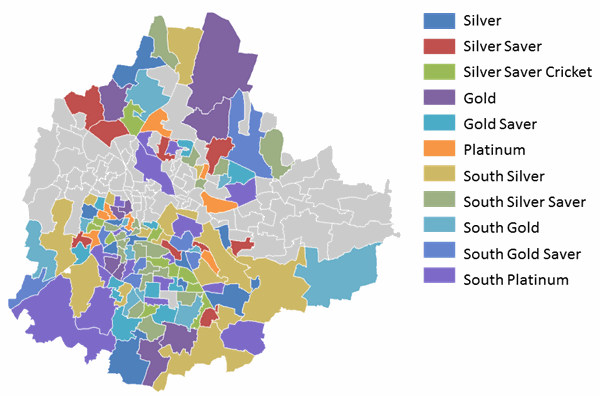
We next looked at the performance of the channels across the various parts of the city, the results are quite striking. This map shows which packages is most popular by location.
In the south-west the South Platinum package is the most popular whereas the Gold package is a hit up North. The areas in the middle from West through East the company has no sales and a potential area that calls for sales effort.
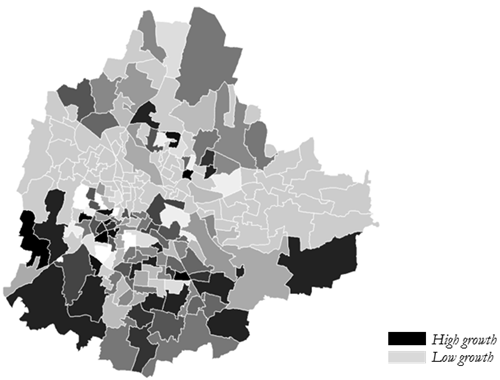
A deeper dive into the individual channels performance in terms of growth clearly provides good insight. Since growth patterns continue for a while, this may be used to direct marketing efforts at a regional level.
This visualization highlights a good case for targeting Gold saver package marketing in the south-west.
A granular geographic performance can help a lot in focusing the effort of the local sales teams and also in shifting the effort to the right areas.
NJBIZ has recognized Naveen Gattu, Founder and Chief Operating Officer of Gramener—A Straive Company, as… Read More
Computer vision (CV) has become an essential platform in the rapidly changing technology. It is… Read More
Are you struggling with lengthy and labour-intensive processes of manual inspection at your manufacturing? You… Read More
Managing smarter inventory is always challenging: too much stock consumes money, while too little results… Read More
The global food industry faces significant losses daily due to the spoilage of perishable goods.… Read More
In today’s fast-paced world of e-commerce and supply chain logistics, warehouses are more than just… Read More
This website uses cookies.
Leave a Comment