Here’s a brief overview of the technology that’s powering the CNN-IBN Microsoft Election Analytics Centre. (That’s the site behind http://bing.com/elections and http://ibnlive.in.com/general-elections-2014/analytics/.)
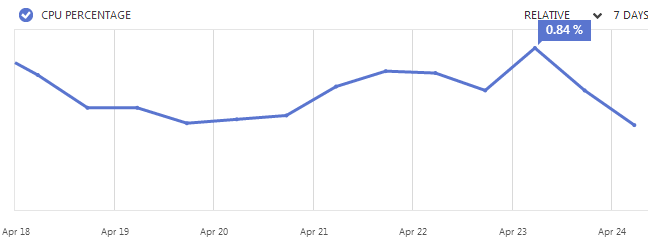
The entire EAC is sitting on a single server in Southeast Asia, hosted on Azure. It’s a virtual machine provisioned with 4-cores and 7GB of RAM. Over the last 2 weeks, it has served 2 million requests with a peak CPU utilisation of less than 1%.
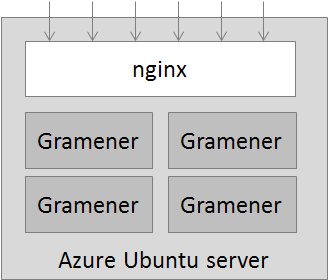
Behind this runs 4 load-balanced instances of the Gramener visualisation server. These create the actual visualisations that are displayed on Bing and IBNLive.
All visualisations are rendered as SVG, which makes it easier to scale across devices, as well as making them amenable to animation. On the server side, the Gramener visualisation server (which is written in Python) generates the SVG using templates.
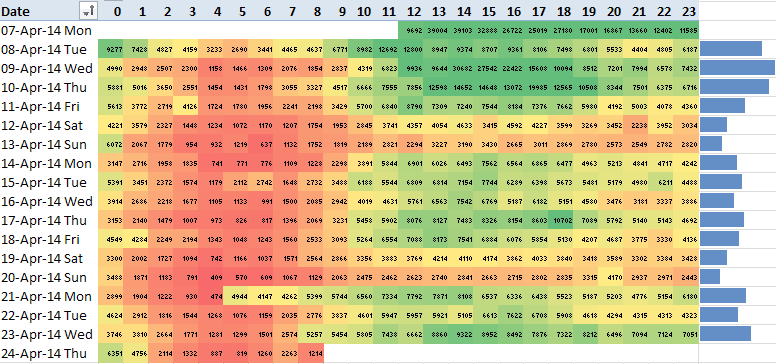
The traffic follows a predictable pattern. The bulk of the visits are between 10am and midnight, with significant drops during weekends.
The early enthusiasm during the first few days of polling has calmed down, and is replaced by the steady interest of the enthusiasts. The traffic will, of course, spike during the elections.
The popular are well represented in this mix, with Chrome leading at around 56%, followed by Internet Explorer at 27% and Firefox at 17%.
Mobile devices are well represented too, with Windows Phone leading at 55% share, followed by Android at 24%, iPad at 11% and iPhone at 12%. (BlackBerry, for the curious, is under 0.5%)
Of the visuals themselves, the most popular (by far) is the cartogram, followed by the stack bar summarising the history of all elections so far.
Following in popularity are the constituency page, state page, factoids page, summary statistics page and patterns page.
Over the next few weeks, we plan to add more visualisations, covering how the country performed under various governments, how manifestos of parties differ, the live status of parties on counting day, and so on. Stay tuned.
NJBIZ has recognized Naveen Gattu, Founder and Chief Operating Officer of Gramener—A Straive Company, as… Read More
Computer vision (CV) has become an essential platform in the rapidly changing technology. It is… Read More
Are you struggling with lengthy and labour-intensive processes of manual inspection at your manufacturing? You… Read More
Managing smarter inventory is always challenging: too much stock consumes money, while too little results… Read More
The global food industry faces significant losses daily due to the spoilage of perishable goods.… Read More
In today’s fast-paced world of e-commerce and supply chain logistics, warehouses are more than just… Read More
This website uses cookies.
Leave a Comment