This is a guest post by Nirav Chadda
Amidst the FIFA world cup fever, a few visual designers got together to celebrate it in a different way and met at Gramener. We explored the past, studied the trends and predicted the future. Each did it in their own amazing styles.
I tried to visualize a layout which had two views namely:
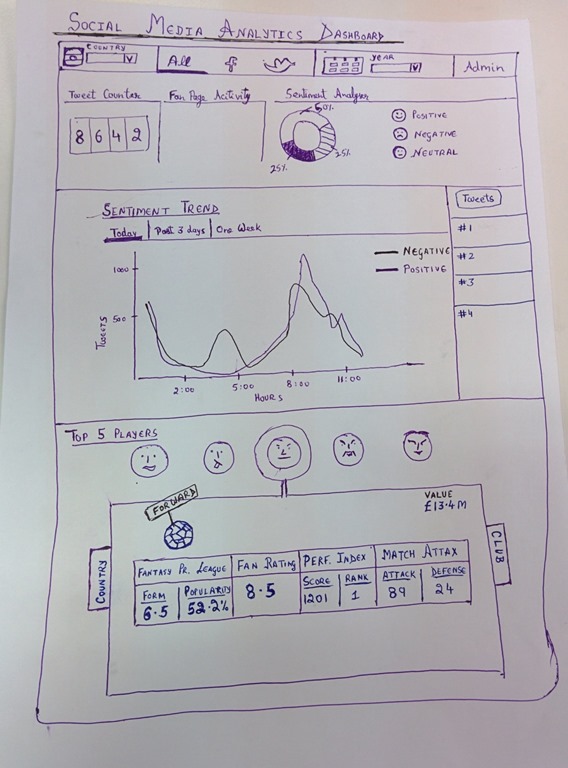
Social Media Analytics Dashboard: In here, I have tried my best to analyse all the available social media data and show it to the user in as simple a form as possible.
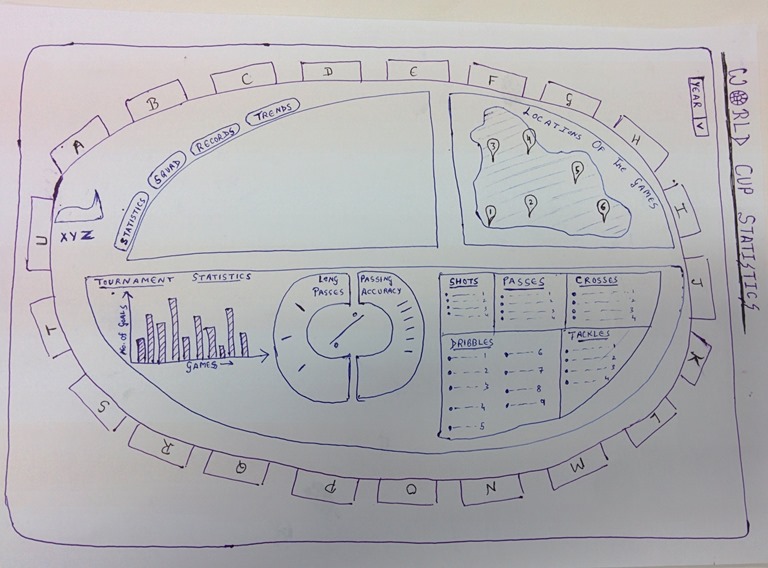
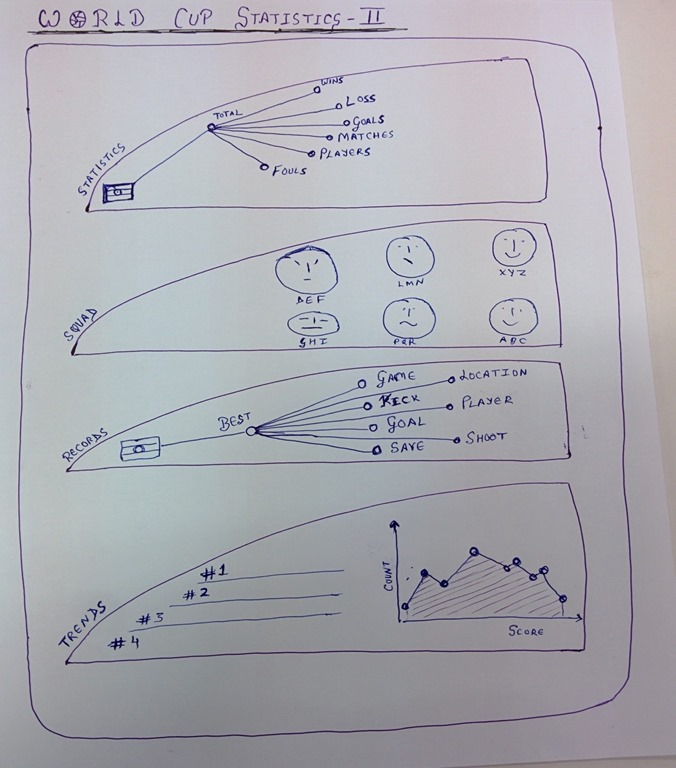
World Cup Statistics Dashboard: Here I aim to just use one filter, i.e. year, and show all the past statistics for every country in shape of a football field.
The aim of both these dashboards is to look at the trends or stats at a place and at a go,in a very user friendly way.
Industry 4.0 solutions originally had their genesis in manufacturing. “The Fourth Industrial Revolution, Industry 4.0,… Read More
Improvement in production performance can enhance supply chain efficacy. There is a continuous discourse around… Read More
Sshhhhhh, ChatGPT knows everything!! In 2023, Generative AI (GenAI) emerged as a major technology disruption… Read More
Generative AI holds immense promise for healthcare, leveraging large datasets to innovate medical imaging, treatment… Read More
NJBIZ has recognized Naveen Gattu, Founder and Chief Operating Officer of Gramener—A Straive Company, as… Read More
This website uses cookies.
Leave a Comment