At Gramener, we have been continuously evolving our Design process over the past years. These improvements have been to stay in tune with the emerging trends in design, adopt industry standard tools and create a custom Design framework that helps us deliver outstanding visualizations.
This post covers the ‘tools’ aspect of the design improvements we’ve implemented, and it discusses the challenges faced and considerations on coming up with a pertinent toolset to cater to Gramener’s core offering of Information Design & Data Visualization.
Earlier Process brief and toolset used:
Until a year back, the primary tool we used during the design phase was paper-pencil for creation of Design concepts, while the actual designs were created on Powerpoint. For most engagements we had a low-fidelity design as deliverable, wherein the paper sketches were translated to a basic representation on MS Powerpoint using snipped images of charts and other basic dashboard components.
In certain engagements, when there was a need to show a closer-to-actual representation, a high-fidelity design was created, again on Powerpoint using imported SVG objects or drawn chart elements. There was almost no prototyping or demonstration of interactivity, save the occasional powerpoint slide transitions. The need for an internal Design library was met by having all designs stored on the Gramener file server and exposed on a searchable, minimalistic UI, that was spruced up with basic previews and meta-tags.
Given the ability of Gramex, Gramener’s platform to quickly pull out charts from the engine’s library and setup a basic, working version of visual dashboards, historically, there was not much of a need for a standardized design tool. Hence, Powerpoint was a quick and light alternative that fit in well with the skillset of Data Consultants, which is a role comprised of functional analysts, who had innate comfort with MS Office rather than the Adobe suite of products.
Evolving needs:
With the evolution of projects done by Gramener and the rapid scale-up in clientele and team size, the need was felt for a rethink of the above mentioned stack. With a large number of first-time visualization adopters amongst clients, we sensed their comfort in reviewing solutions with a high-fidelity design that showed visual design aspects as close to the final solution as possible.
With increasing functional complexity and data size of our visual solutions, Data Consultants had to spend more time in the solution conceptualization and data analysis phases, whereas there was an increased need for additional support during the Design phase.
Challenges faced:
In summary, the key challenges faced with the above simplistic process & toolset were:
- Variation in quality, finesse and look-and-feel of designs created on Powerpoint
- Long cycle time for design creation, with an often cumbersome process for putting together the occasional high-fidelity versions
- Teething challenges in development handover & translation of the design
- Need for multiple design reviews during development phase, coupled with rework
- Difficulty in demonstrating state transitions, interactivity and user flow within a visual application concept
Alternate Solution:
Given these challenges and the additional considerations of scalability & rapid replicability, we went about evaluating changes needed in the process, toolsets & framework. We spoke to the design community and took first-hand advice from experts in these areas. From the tools perspective, we evaluated a variety of visual design and prototyping tools including Adobe Photoshop, Illustrator, Balsamiq, Axure and Pinegrow, amongst others. Based on considerations of fitment to our visualization lifecycle, availability of complementary skillsets at Gramener and ability to address the challenges outlined, we zeroed in on the following:
Sketchapp – for Visual Design:
The vector graphics editor from Bohemian Coding has been rapidly gaining popularity and has quickly built its own community of loyal users. With addition of new role of Information Designer at Gramener, this tool helped us in the following ways:
- We found that the tool was very easy to pickup due to its intuitive usability, perhaps closer to Powerpoint. It also had ample tutorials and a robust support ecosystem
- By design, the tool was meant to create vector objects and naturally fit in better for dashboards and web applications, while other tools were heavily skewed towards graphic design
- Has a thriving ecosystem of plugins for productivity improvement, and importantly provides for easy export of style sheets to aid development translation
- Comes at a relatively economic price compared to popular options, Apple hardware prices notwithstanding
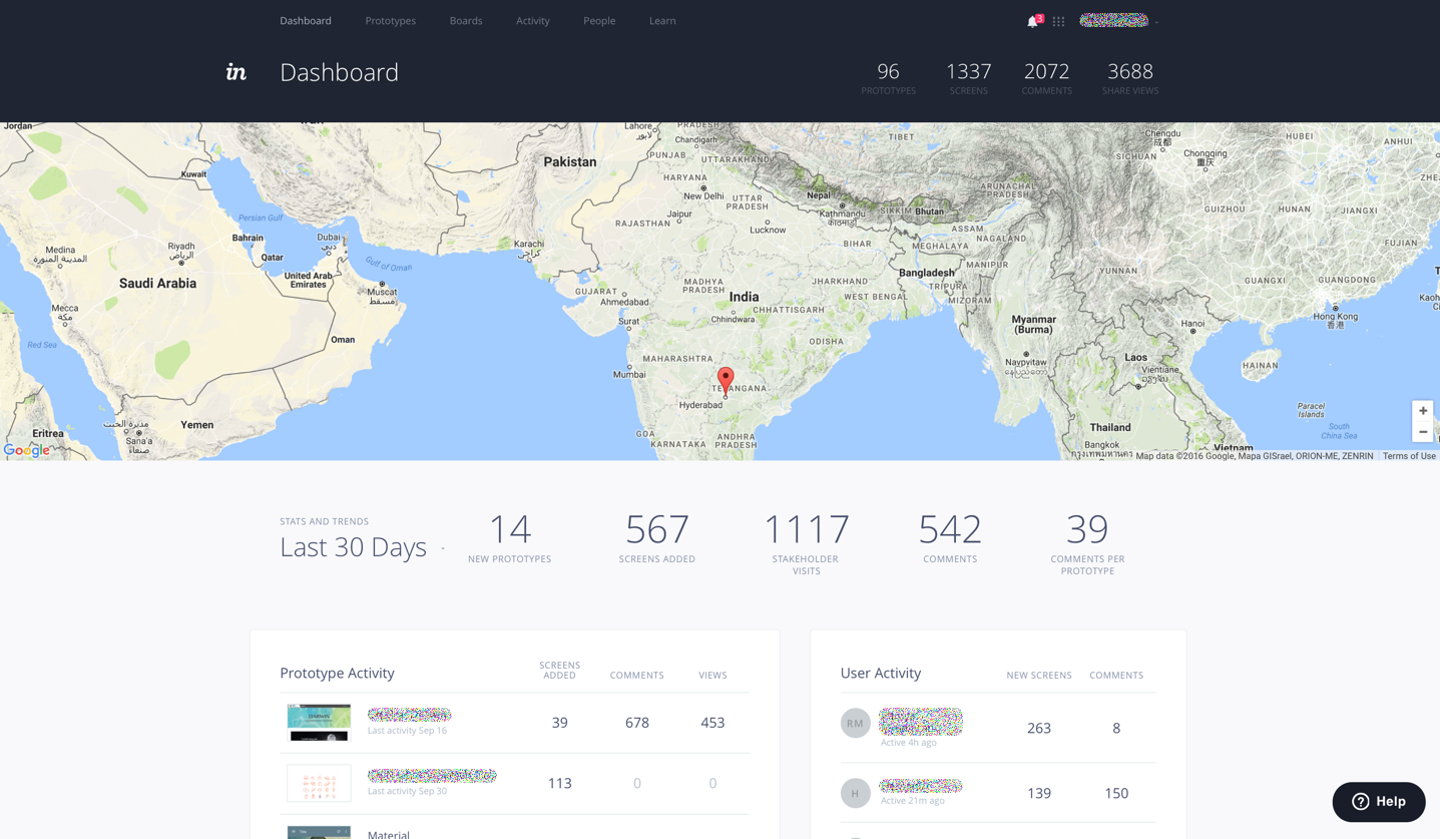
Invision – for Workflow, Prototyping and Design library:
A leading prototyping, collaboration and workflow platform used by several design houses around the world, this tool checked-off multiple items in our requirements list:
- Provides an end-to-end design workflow solution with useful admin features
- Has native integration with Sketch and hence it automatically syncs, imports and stores assets from Sketch files. Automatically creates style sheets & enables direct look-up
- Supports basic prototyping needs to show interactivity and transitions
- Has useful collaboration & commenting features, and integrates live design presentation and review capability
- Doubles up as a repository with versioning & hence can be used as a design library
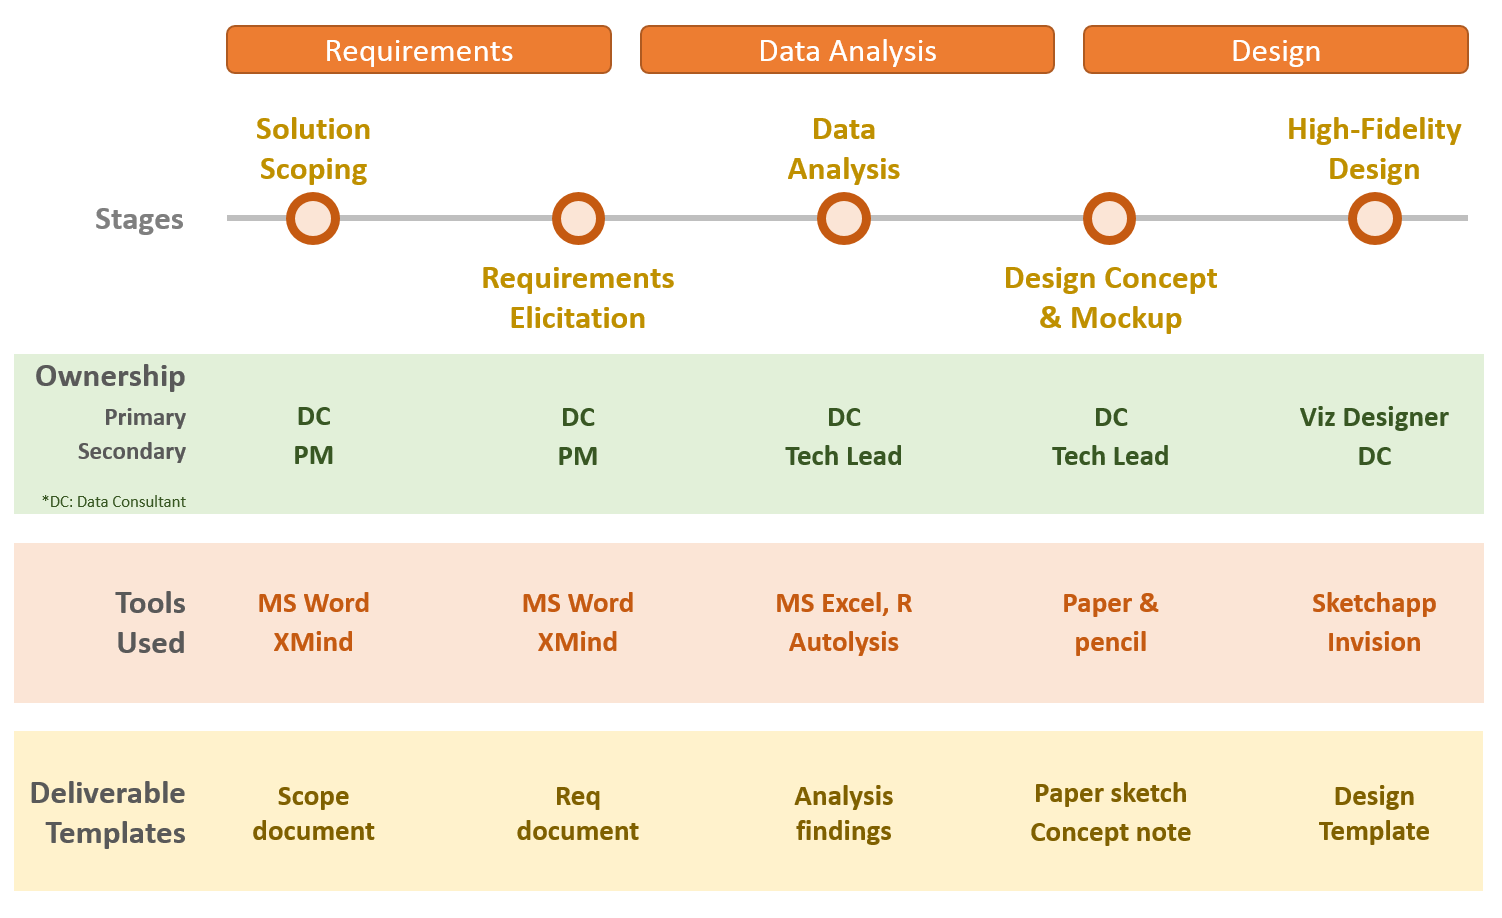
In Summary, below is the overall process that we have arrived at, which has been working well for us and has addressed most of the above-mentioned issues we faced: