
By Bhanu Kamapantula
Data visualization as a domain has traditionally been accessible predominantly to people with programming background. This involves designing a visualization, implementing the solution using a programming language with supporting libraries, if necessary. Visualization libraries — which require little programming experience — created in the past few years which are gaining momentum include RawGraphs, DataWrapper, Tableau (to an extent) (extensive list). Text narration in charts (created by the data viz community or news organizations) are not as legible as they could be.
Bringing designers to the table
Given this, few font styles have emerged to visualize data. Designers and typographers can create new font-styles, which are already well supported in the web development, not for language alphabet but for data.
How-to
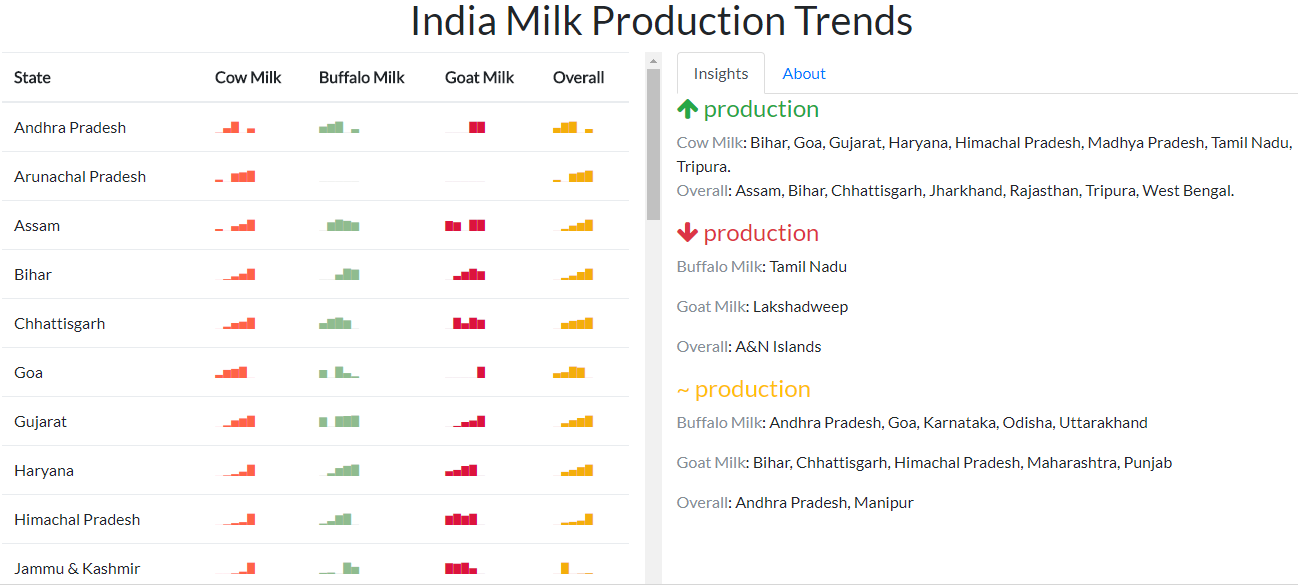
Here, we generate basic charts using AtF-Spark font. Currently, the AtF-Spark font requires values to be within 0 to 100 or 0 to 9 depending on the chart type. Hence, raw values are scaled between 1 and 100 (for bar-medium), and are hence representative. A small set of charts are supported currently: bar chart (thin, narrow, medium styles), dot chart (small, medium styles), dot line chart (medium).
Input
{21,0,75,85,100}
Output
Read: How we used AtF-Spark to compare Milk Production in Indian states
Advantages, Limitations
- easy to create, no programming required
- copy the underlying values in a chart
- charts are representative of data since they are scaled between 1 to 100 or 1 to 10 (depending on chart type).
- charts are not interactive
Recently, we have seen multiple reactive documents [Idyll, Tangle] techniques which will be instrumental for scientific, journalistic reporting apart from automatic narration for visualizations. With font-style charts, data visualization community needs more of these approaches with participation from diverse domain backgrounds. Among other things, this will be a game changer for narrative style communication for data-based products.
Links
1) AtF-Spark font style – aftertheflood.co/projects/atf-spark
2) Datalegreya – figs-lab.com/en/datalegreya
3) FF Chartwell (paid) – https://www.fontfont.com/how-to-use-ff-chartwell
4) Idyll – http://idyll-lang.org/
5) Tangle – http://worrydream.com/Tangle/