
Gramener’s Richie Lionell writes in defense of Excel
I come from a tribe whose first brushes with data visualization began with Excel. It all started when my former boss in early 2011 said, “Have you heard of charts that fit into an Excel cell? Please can you find out what that is all about?” In-Cell charts were an eye-opener but thankfully my eyes were also opened to what one could do with shapes, colors & tweaked charts. The world of Python, D3.js, design & story telling then beckoned me and it was hard to resist. I took the plunge but in the overflow of joy that followed I haven’t left Excel behind.
Excel????? – People cringe and then I show them a few unconventional visuals we’ve created using Excel;
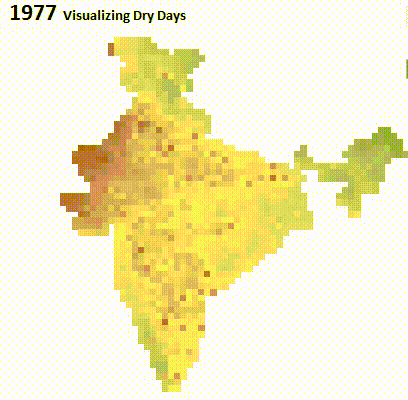
A 0.5 grid Lat-Long weather map of India we created on Excel cells – supported by VLOOKUP, IFERROR, a scrollbar & conditional formatting – is a major draw at our Dataviz trainings. It is a visualization of dry days in every 0.5 degree Lat-Long grid from 1977 to 2005. No images or shapes were used. Yup, no VBA too & created using Excel 2010.
How about using Excel for some story telling? This one is the story of Hollywood stars, the data coming from an Excel table.

No, the pictures of the celebrities are not images. They are Dingbat fonts (Ever wondered the use for Webdings & Wingdings?). No VBA here too, just the usual suspects – VLOOKUP, IFERROR – and a bunch of radio buttons.
Here’s a simulation of a chess game (Dingbats again).

You can do all of the above using Excel 2007. Yes, you read that right. Now open your Excel application and plead for forgiveness. With this newfound respect for Excel you can now learn how to Visualize Sensex returns in Excel.
cool visuals. But I guess tableau is a better tool for that.
Here is what I think about excel:
1) Excel will mess-up with your dates. It may be confused if the dates are dd/mm/yy or mm/dd/yy
2) Excel does not play well with large spread-sheets.
3) Some basic stuff like removing duplicates can be pretty complicated in excel.
https://support.office.com/en-us/article/Filter-for-unique-values-or-remove-duplicate-values-ccf664b0-81d6-449b-bbe1-8daaec1e83c2
Compare this with a single method call .drop_duplicates in pandas.
http://pandas.pydata.org/pandas-docs/stable/generated/pandas.DataFrame.drop_duplicates.html
4) Excel does not integrate well with other applications like word or powerpoint. It is best used as stand alone tool.
5) Excel is relatively difficult to learn. At some point in future, I will need to invest time in learning VBA. Why not learn python instead?
This is fantastic! Well written to describe the unexplored territory of excel.
Excellent Richie… Loved it! Food for my thoughts