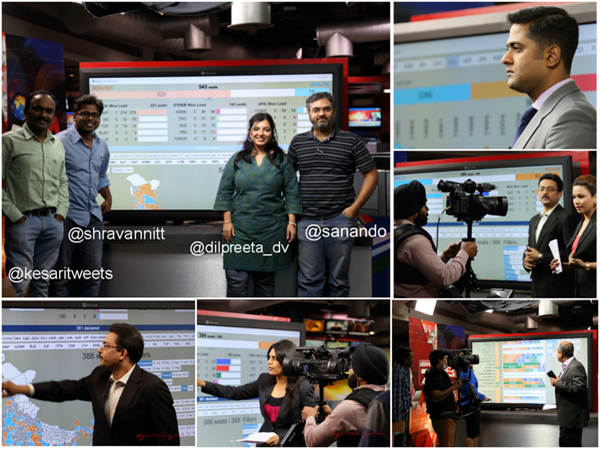
Our CNN-IBN Microsoft Election Analytics Center, which you can see the live visualisations, has served over 7 million requests in the last 8 hours..
This includes real-time filtering of the election commission results – based on turnouts, margins, computations of anti-incumbency factors, alliance groupings, etc.
The data resides in an SQL Server hosted on a Windows Server at CNN-IBN’s office at Noida. This data is fed real-time into the Gramener visualisation server, running on an Azure virtual machine at Singapore.
This is one of the largest real-time visualisations that we (and perhaps many others) have attempted. Yet all of these computations were handled by a single 4-core 7GB RAM server running 4 instances of the Gramener visualisation server. (For comparison, this blog post is written on an 8-core 8GB RAM laptop.)
This system saw a peak load of 450 requests per second and average load of 260 requests per second. For comparison, Wikipedia serves about 100-200 requests per second on each server. Twitter serves 600 requests per second.
A big thank you to all of you who visited our site. We’re happy and proud.
