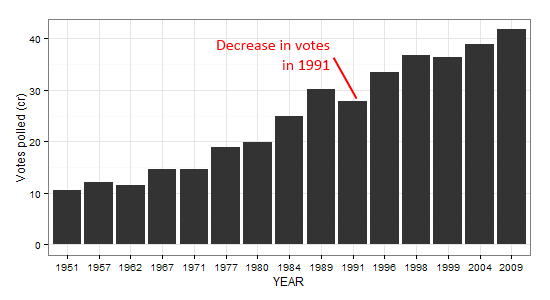
A lot has changed in the 60+ years since our first elections. To begin with, the number of voters has gone up almost consistently, year on year – which is to be expected given population growth. However,.in 1991 there is a notable dip in the number of voters, despite a growth in population. The voter turnout dropped from 62% in 1989 to 57% in 1991 (mospi.nic.in, PDF).
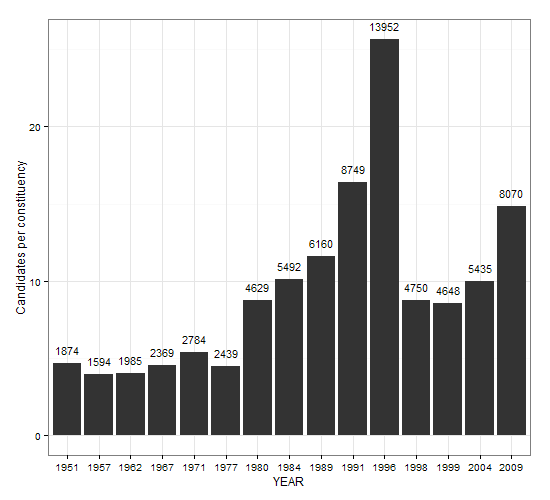
The number of candidates, however, shows a different trend. Between 1977 to 1996, there was a marked, even exponential growth in the number of candidates, leading to almost 14,000 candidates contesting in 1996 – approximately 26 candidates in each constituency, partly due to the deluge of candidates in Belgaum and Nalgonda. Post 1996, the election commission revised the deposit amount from Rs 500 to Rs 25,000, and the numbers dropped to a more reasonable 9 candidates per constituency, though in 2009, this has again risen to 15 candidates. Perhaps, given inflation, it may be time for the ECI to increase the deposit amount again.
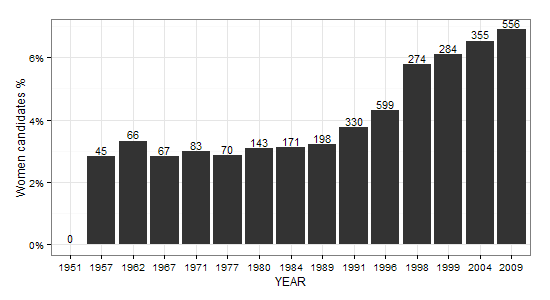
Among these candidates, the percentage of women has generally shown a steady increase, especially starting from 1991. (The ECI data for 1951 does not have gender data.) It’s grown from about 3% to nearly 7% now – but is still a relatively low number.
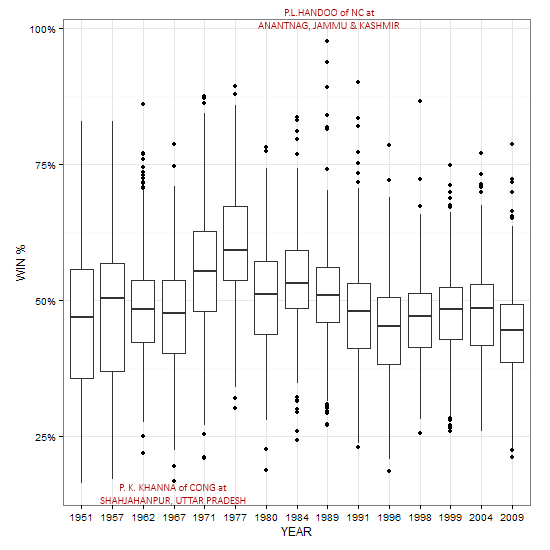
With the growth in number of candidates, one might expect that the winner’s share of votes might decline. Here’s what the distribution of the winner’s vote share looks like.
The highest was P L Handoo of NC who won at Anantnag in 1989 with over 36,000 votes. The nearest competitor, Abdul Rashid Khan, got 186 votes. On the other hand, P K Khanna of INC won at Shahjahanpur in 1967 with 40,000 votes out of 2.4 lakh votes – less than 17% of the electorate!
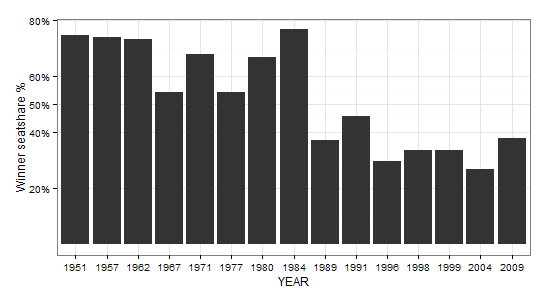
Given the winner-take-all nature of nature of the Indian elections, the winning party need not have a majority of the seats. Below is the % of seats the winning party has won.
Since 1989, the winning party has never received 50% of the number of seats, and in every occasion, has been forced to form a coalition with another party.
In contrast, if we look at the winning party’s vote share (the number of votes they received as a % of total voters), the trend is not as bad. The numbers have been only slightly under 50%, and always above 40%, since 1989. In fact, the situation was worse in 1951 and 1957, when the Congress was in power with a less than 40% vote share.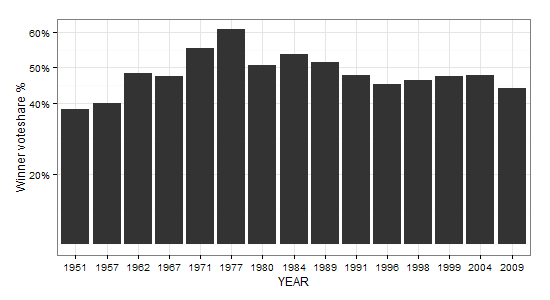
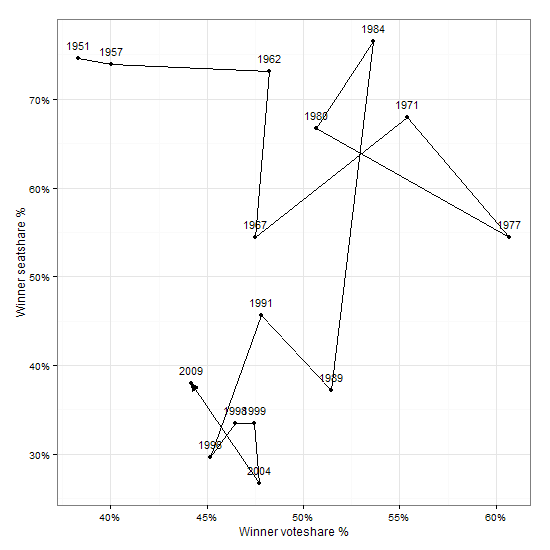
Let’s take a look at both of these together, and see how representative and powerful the various Indian governments have been.
We can almost cleanly segregate the elections into three phases:
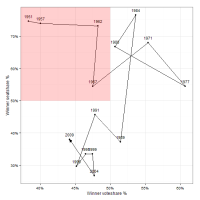
However, the voteshare was less than 50%, i.e. more than half the population had voted for a party other than Congress, and in that sense, the Government was not fully representative of the voters.
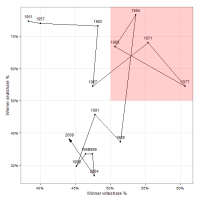
In this phase, except for 1977 when Janata Party was in power, the Congress was in power across the years.
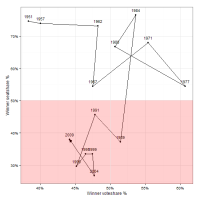
In every year, the seat share has been under 50%, meaning that the winning party cannot form the Government alone; and, except in 1989, the winning party has received less than 50% of the public vote.
All the above data was sourced from the Election Commission website. You can explore the data visually at https://gramener.com/election/parliament.
