As we await the Indian Government’s budget tomorrow, here are some visualisations we created to examine the history of our past budgets.
Working with The Economic Times, we created a view of how the budget breakup has changed by ministry over time.
The large pink region is the Economic Affairs ministry, which takes up the bulk of the spend. Though it has been growing in absolute terms, in relative terms, it has been shrinking in importance. You can see the break-up by plan and non-plan breakups at our ET Ministry-wise Budget Allocation page.
In absolute terms, through, the spend on every sector has been growing smoothly and steadily, barring a few kinks. Among these, the agricultural spending is notable. It spurted up in 2009 to Rs 77 cr, but no subsequent budget has spent as much on agriculture.
One other change that has happened is the relative rationalisation of budgets between 2002 and 2014. While in 2002 (left), the budget was relatively more concentrated among a few departments such as Economic Affairs, Defence, etc, by 2014, this disparity has reduced marginally.
But how do markets react to the budget?
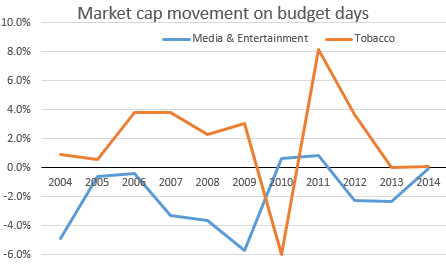
One way of capturing this information is to look at how the market capitalisation of companies has moved on the day of the budget. For example, on the day of the 2007 budget, every single sector’s market capitalisation fell, with the sole exception of Tobacco. The exact same thing happened on the day of the 2009 budget as well.
But on the day of the 2010 budget, there was a perfect reversal of the situation. Every sector except Tobacco improved, while Tobacco (in a rare turn of events), lost considerable value.
In fact, the Tobacco sector is primarily just a single company – ITC, and its fate often moves counter-cyclically on budget days. But budgets are generally good for ITC. In the last 11 budgets, ITC (and Tobacco) has grown except in 2010. On the other hand, the Media and Entertainment industry typically suffers setbacks on budget day. Barring 2010 and 2011, the market cap of this segment has shrunk on every single budget day in the last 11 years.
For more data insights and to explore the history of the Indian Budgets, please visit our site on The Economic Times and on Gramener.com.
Industry 4.0 solutions originally had their genesis in manufacturing. “The Fourth Industrial Revolution, Industry 4.0,… Read More
Improvement in production performance can enhance supply chain efficacy. There is a continuous discourse around… Read More
Sshhhhhh, ChatGPT knows everything!! In 2023, Generative AI (GenAI) emerged as a major technology disruption… Read More
Generative AI holds immense promise for healthcare, leveraging large datasets to innovate medical imaging, treatment… Read More
NJBIZ has recognized Naveen Gattu, Founder and Chief Operating Officer of Gramener—A Straive Company, as… Read More
This website uses cookies.
Leave a Comment