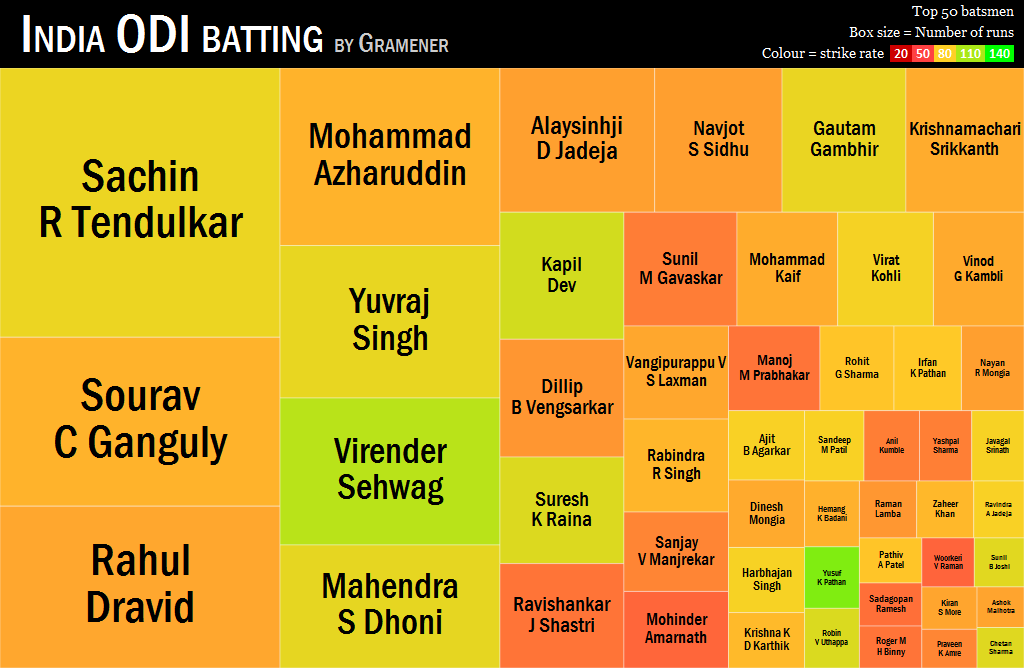
I’ve always been curious… who among India’s prolific one-day run-getters had a good strike rate. This picture below shows you the top 50 ODI run getters for India.
The little squares indicates one player. The size indicates the number of runs scored, and the colour indicates the average strike rate. (Red is poor, green is high).
Firstly, you can see that Sachin, apart from being a prolific run-getter, is slightly above average. The same can’t be said of the next three: Saurav, Azhar and Rahul. The next three however, Yuvra, Sehwag and Dhoni, are as fast or faster run-getters than Sachin – especially Sehwag.
We do have a few low scorers there – Sunil Gavaskar, Ravi Shastri, Mohinder Amarnath, Dilip Vengsarkar, etc.. but allowance must be made for the increase in run rate over time:
In the 1975 World Cup, for instance, the average run-rate in the entire tournament was 3.91 runs per over; in the next edition, in 1979, it dropped to 3.54. Compare that with the run-rate in the most recent edition of the World Cup, when the overall tournament scoring rate exceeded five for the first time, and it’s obvious that the way the ODI is played has changed hugely over 35 years.
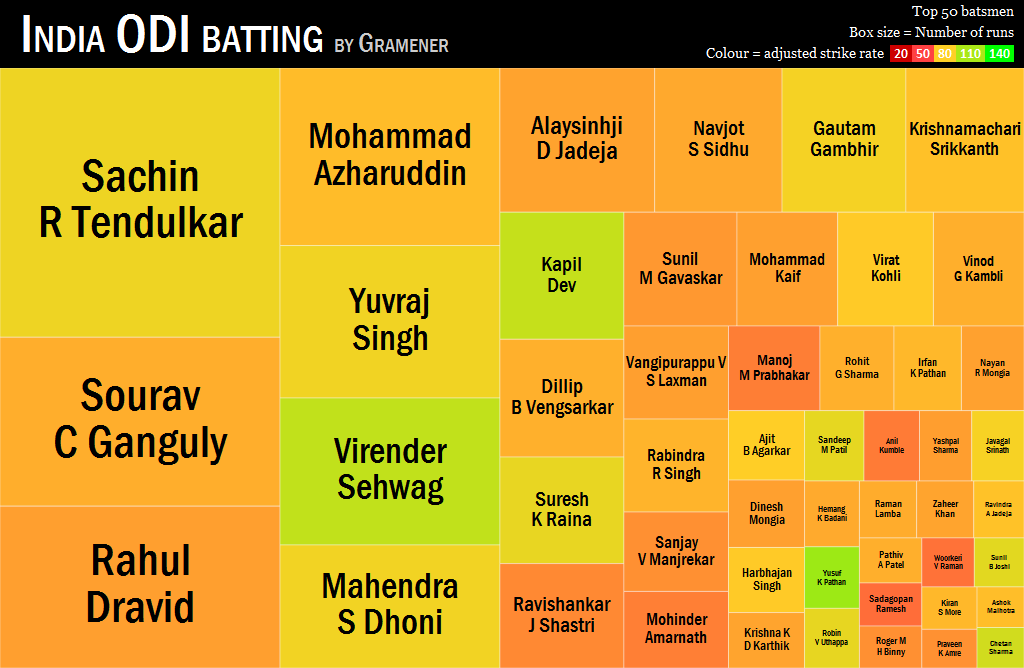
For Indian batsmen, the strike rate seems to go up at about 3.4% every decade. Adjusting for that, this is what the picture looks like:
These players do look a bit better now, but they’re still fairly slow. The big exception of that generation was Kapil Dev. His strike rate is the only one that rivals Virender Sehwag’s rate today.
Based on this picture, if I were to pick the top 3 fast run-getters across time, I’d pick Kapil Dev, Sehwag and Yusuf Pathan. The slowest would probably be Mohinder Amarnath, Manoj Prabhakar and Sadagopan Ramesh.
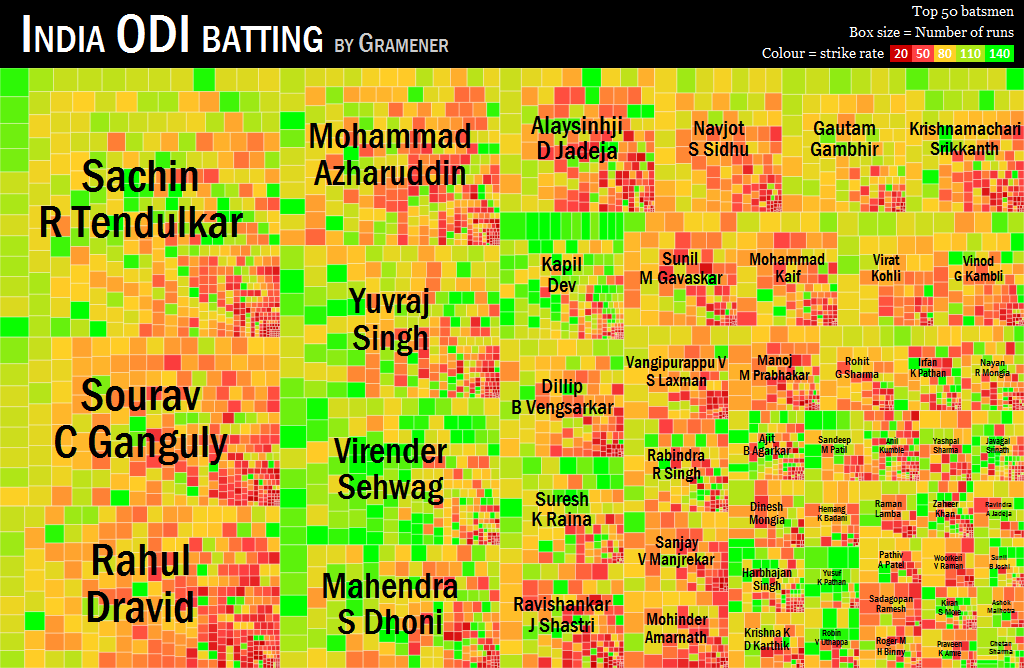
We can drill a little deeper into their performance, at a match-level. In the picture below, each box is a match, colour coded by strike rate.
A pattern emerges here: higher totals (on the top left for each player) are scored at a higher strike rate. This isn’t particularly surprising, however.
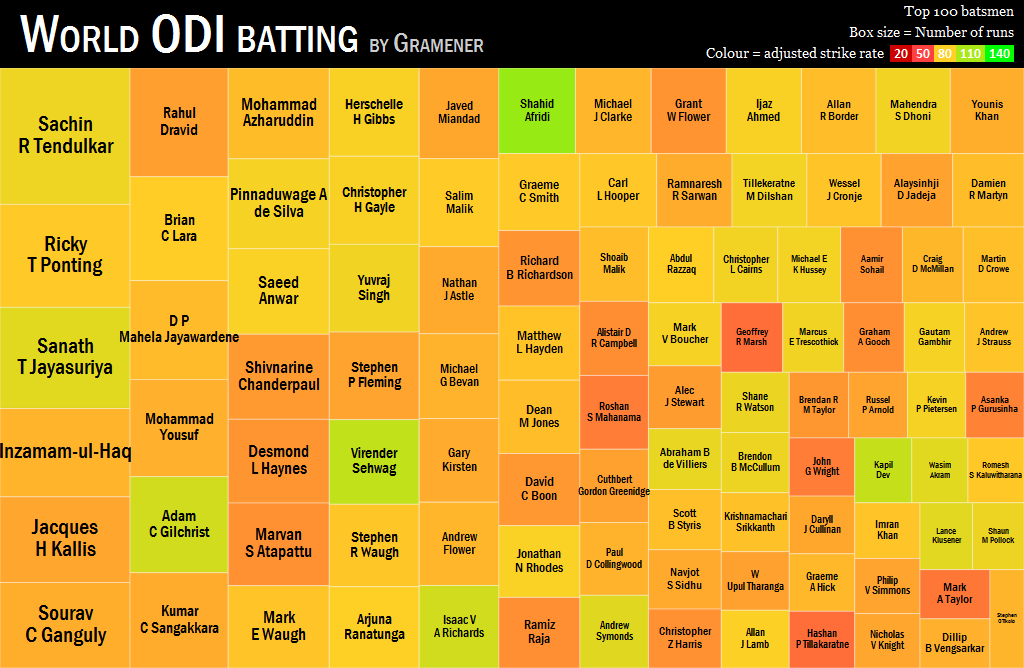
Another interesting view is to see how our batsmen fare against the rest of the world. On an adjusted basis, this is what it looks like:
Shahid Afridi, with an average strike rate of 115 stands way above the rest – and the second player on this list is Sehwag. Interestingly, Afridi has just a few less runs than the legendary Viv Richards, but these have been scored at a much faster rate than even the master blaster.
Visit gramener.com/cricket to see the cricket visualisation live.
The visualisation you just saw is a Treemap. It’s a very powerful way of comparing elements in a hierarchy with relative importance. Some other ways you can use treemaps in a business context are:
Industry 4.0 solutions originally had their genesis in manufacturing. “The Fourth Industrial Revolution, Industry 4.0,… Read More
Improvement in production performance can enhance supply chain efficacy. There is a continuous discourse around… Read More
Sshhhhhh, ChatGPT knows everything!! In 2023, Generative AI (GenAI) emerged as a major technology disruption… Read More
Generative AI holds immense promise for healthcare, leveraging large datasets to innovate medical imaging, treatment… Read More
NJBIZ has recognized Naveen Gattu, Founder and Chief Operating Officer of Gramener—A Straive Company, as… Read More
This website uses cookies.
View Comments
the very nice blogs for India's most popular player in detail and ten for the player in ODI cricket in all betting and blowing.