Our CNN-IBN Microsoft Election Analytics Center, which you can see the live visualisations, has served over 7 million requests in the last 8 hours..
This includes real-time filtering of the election commission results – based on turnouts, margins, computations of anti-incumbency factors, alliance groupings, etc.
The data resides in an SQL Server hosted on a Windows Server at CNN-IBN’s office at Noida. This data is fed real-time into the Gramener visualisation server, running on an Azure virtual machine at Singapore.
This is one of the largest real-time visualisations that we (and perhaps many others) have attempted. Yet all of these computations were handled by a single 4-core 7GB RAM server running 4 instances of the Gramener visualisation server. (For comparison, this blog post is written on an 8-core 8GB RAM laptop.)
This system saw a peak load of 450 requests per second and average load of 260 requests per second. For comparison, Wikipedia serves about 100-200 requests per second on each server. Twitter serves 600 requests per second.
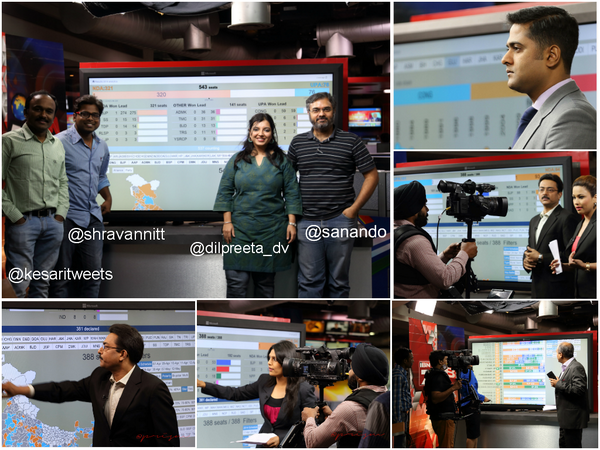
A big thank you to all of you who visited our site. We’re happy and proud.
Industry 4.0 solutions originally had their genesis in manufacturing. “The Fourth Industrial Revolution, Industry 4.0,… Read More
Improvement in production performance can enhance supply chain efficacy. There is a continuous discourse around… Read More
Sshhhhhh, ChatGPT knows everything!! In 2023, Generative AI (GenAI) emerged as a major technology disruption… Read More
Generative AI holds immense promise for healthcare, leveraging large datasets to innovate medical imaging, treatment… Read More
NJBIZ has recognized Naveen Gattu, Founder and Chief Operating Officer of Gramener—A Straive Company, as… Read More
This website uses cookies.
Leave a Comment