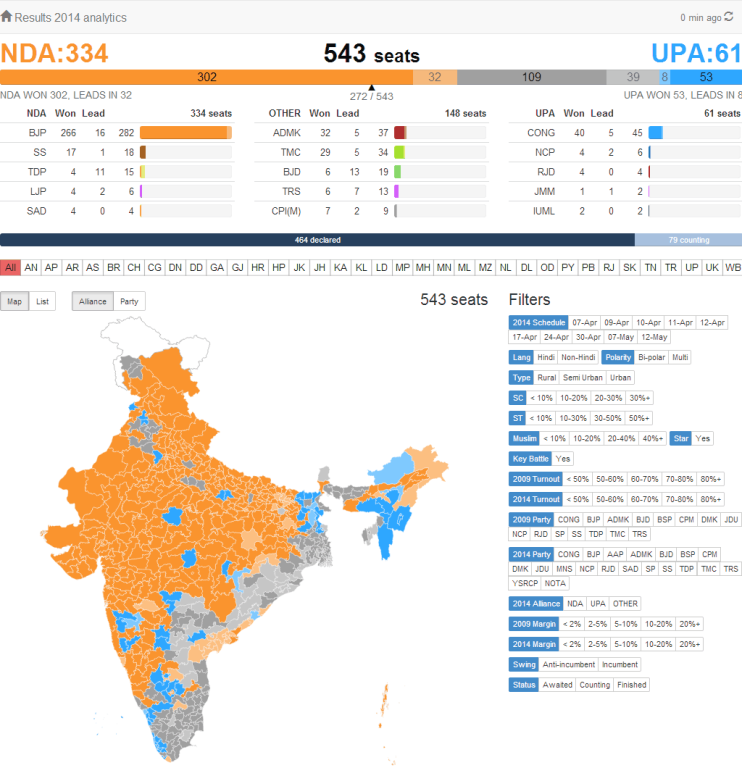
Once we had the design and back-end technology running, it was time to build the live election results page itself.
Sever-side or client-side?
The key considerations here were speed and load. We wanted users to get the results as quickly as possible without overloading our servers.
Generating pages on the server lets us cache the results across users. This is how most pages were built when analysing historical election. But while this reduces the load on the client-side, it increases the page size quite a bit. The alternative is to just send the data across and have the browser render it using Javascript.
These visuals are in SVG – so that already excludes IE8 and older browsers. For the rest of the browsers, as long as we kept the calculations simple, there would be no issue in terms of browser capability.
What libraries?
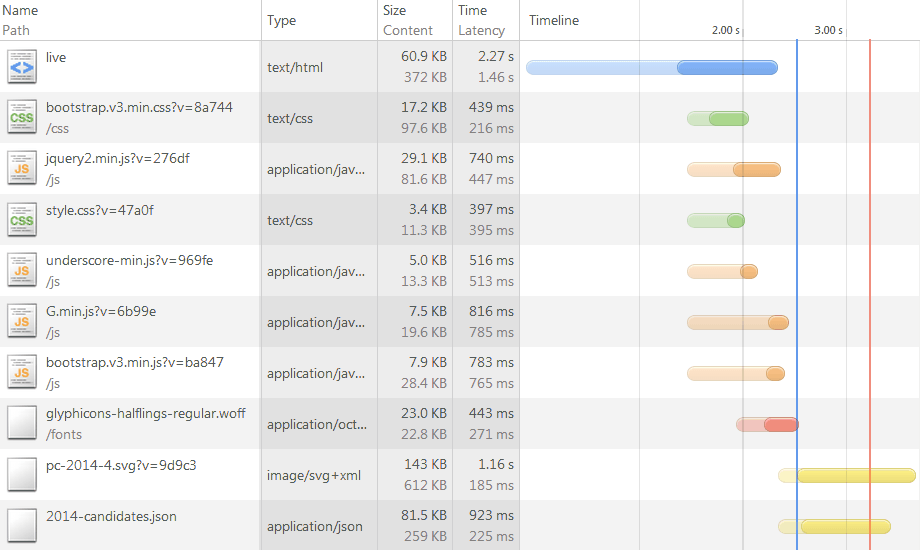
The easiest way for you to explore this is to look at its source. To begin with, here’s a snapshot of the URLs loaded by the page. (This is a snapshot taken on a mobile broadband connection to simulate the relatively slower modem-like speeds.)
After the main /live page is loaded, we load 6 CSS / Javascript files in parallel.
We did explore the possibility of keeping the page lighter and going without these libraries. But three things suggested otherwise. First, their size was only 54KB gzipped. In contrast, the rest of the page + data was 285KB. Second, there still are too many browser issues for us to get to a good browser speed. Lastly, most users on this page would be repeat visitors – so these libraries would be cached the first time and do not add to the burden.
We chose Bootstrap many months ago for the election analysis page and continued the choice here. Bootstrap requires jQuery.
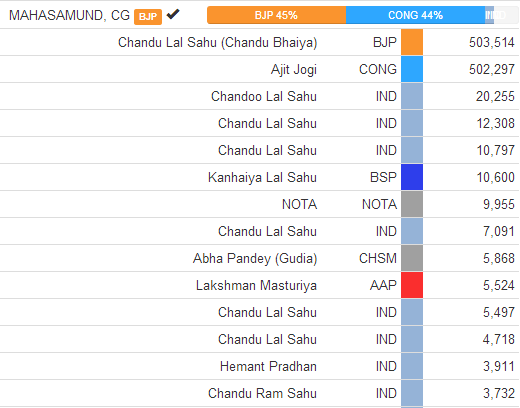
Underscore.js, however, was chosen for a single reason: it’s templates. Ever since John Resig created a micro-templates, we’ve been a fan of this approach. For example, to create this table of candidates in each constituency (and yes, there really where 11 Chandu Lal Sahus contesting)…
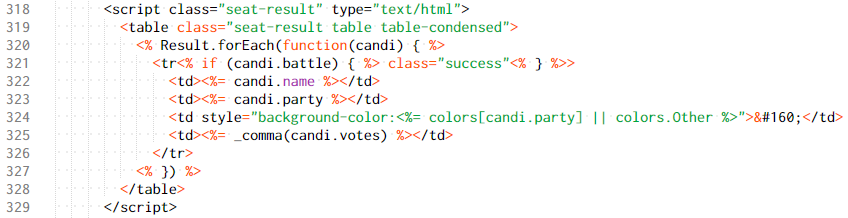
… and to have it updated every time the results change, this is the code required:
The key to the structuring of this visual was to load all static data upfront, and minimally refresh with the dynamic data.
Structuring the data
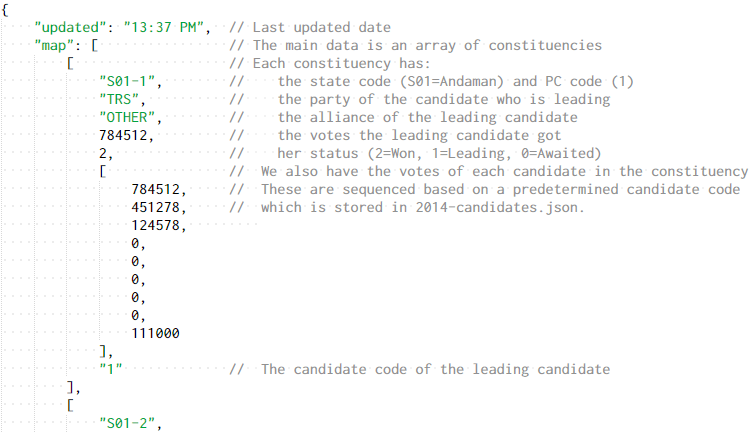
The only thing that changes during the elections is the number of votes for a candidate. So, theoretically, if we sent 8,000 numbers as updates every time, the browser can calculate the rest.
In practice, however, the votes are not available until much later. Only the winner / leading candidate is known. So we went for the a single JSON file that captures the minimal data required for display.
(Why JSON instead of CSV? Because it supports hierarchies, browsers parse it natively, and when gzipped, it’s not much larger than CSV.)
This file grew from ~20KB (when all votes were 0) to ~65KB (after results were declared). When compressed, this is just 27KB, which makes the updates extremely light.
Filtering the data
Since all data is available at the client side, all filtering also happens on the client side. To ensure that the filtered URL is shareable, we use history.pushState to change it, but do the computations in-browser without accessing the server.
The URL structure of the filter closely matches that of the data columns. For example, these filters those constituencies where BJP is leading in 2014. These filters can be selected multiply – so you can see the results of BJP + SS here – as well as independently – so you can see where BJP won in Rural India. This makes it intuitive to the developers to add new filters as well.
It’s all in the browser
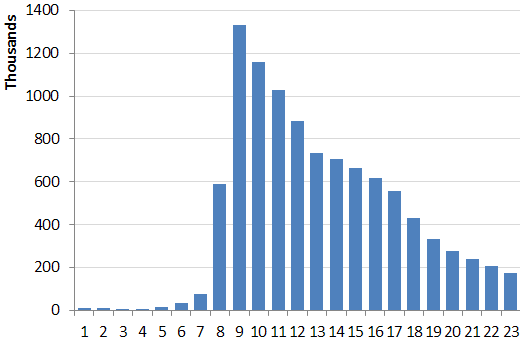
As a result of client-side rendering and filtering, the only time the user accesses the server is to fetch new data. We provided a refresh button on the top-right, but for the anchors presenting on PPI device in the CNN-IBN office, we needed an auto-refresh facility that would refresh at least once every 10 seconds.
So we built a secret ?refresh= parameter and applied it on this device. We did not apply auto-refresh in the morning since we were worried about the kind of traffic load that the site could handle.
But once the traffic started decreasing at around 9:30am…
… it became obvious that a refresh of every 5 minutes wouldn’t hurt things, and would definitely improve the experience. We set it up to auto-refresh every 5 minutes by default.
You can always explore further by exploring the source at view.
Industry 4.0 solutions originally had their genesis in manufacturing. “The Fourth Industrial Revolution, Industry 4.0,… Read More
Improvement in production performance can enhance supply chain efficacy. There is a continuous discourse around… Read More
Sshhhhhh, ChatGPT knows everything!! In 2023, Generative AI (GenAI) emerged as a major technology disruption… Read More
Generative AI holds immense promise for healthcare, leveraging large datasets to innovate medical imaging, treatment… Read More
NJBIZ has recognized Naveen Gattu, Founder and Chief Operating Officer of Gramener—A Straive Company, as… Read More
This website uses cookies.
Leave a Comment