The Mahatma Gandhi National Rural Employment Guarantee Act funds rural employment. Their website provides reports regarding NREGA’s financial performance. Below is a visualisation of their performance for the year 2009-10 (as of March 2010).
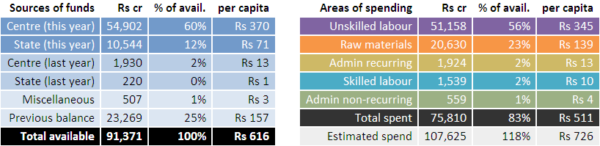
Summary of funds and spending
About 60% of the Rs 46,000 crores available was funded by the Centre this year, with the States contributing only 12%. The bulk of the rest are from the previously available balance. This 46K crores translates roughly to Rs 600 per person in the rural areas (based on the rural population of 74 cr in the 2011 census).
The majority of the spend goes towards unskilled labour, followed by materials. The total spending so far accounts for 83% of the available funds. Based on current estimates, the actual spend will be 18% in excess of the available funds.
Visualisation of the State-wise data
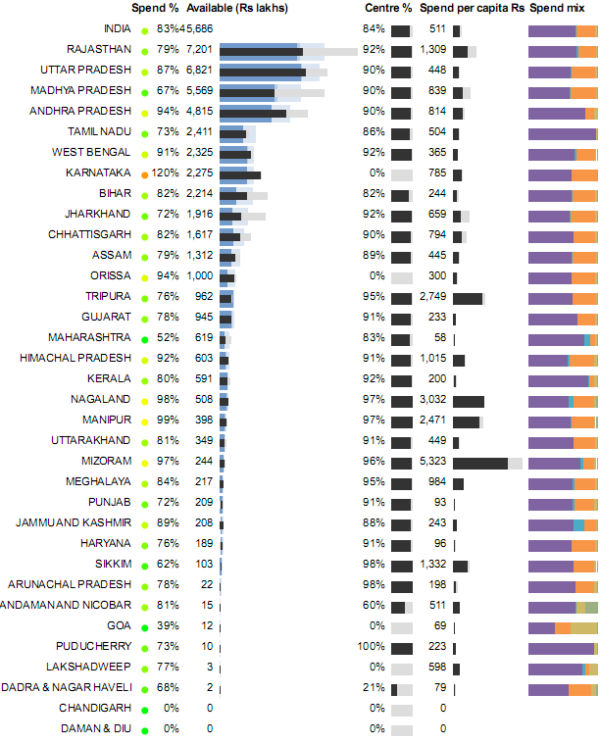
The Visualization chart below shows the spending by state, sorted by available funds. The first column shows the % Spend as a ratio of available funds. Other than Karnataka, all other states have stayed within their funding limits.
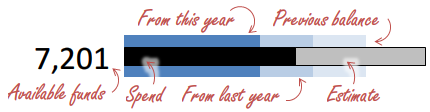
The next column is a chart that shows a number of things, as given in the legend below, which helps with the way to read the actual chart.
You can see, based on this, that
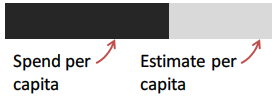
The spend per capita column shows the amount spent per person in the rural areas, and the estimated spend per person. The rural population for the state is based on the 2011 census data.
The North-Eastern states of Tripura, Nagaland, Manipur and Mizoram are the ones that receive the highest assistance per-capita. Outside of these, Rajasthan and Himachal Pradesh too have a fairly high level of per-capita assistance.
The last column shows the mix of spending. Most states spend on unskilled labour and materials, and very little else. The only exceptions are:
For the raw data, please visit the NREGA website.
Industry 4.0 solutions originally had their genesis in manufacturing. “The Fourth Industrial Revolution, Industry 4.0,… Read More
Improvement in production performance can enhance supply chain efficacy. There is a continuous discourse around… Read More
Sshhhhhh, ChatGPT knows everything!! In 2023, Generative AI (GenAI) emerged as a major technology disruption… Read More
Generative AI holds immense promise for healthcare, leveraging large datasets to innovate medical imaging, treatment… Read More
NJBIZ has recognized Naveen Gattu, Founder and Chief Operating Officer of Gramener—A Straive Company, as… Read More
This website uses cookies.
Leave a Comment