Political Visualization in partnership with Vijay Karanataka (Times Group).
Having proved the value of data visualizations in corporate decision-making, Gramener advances one step further into Data Driven Journalism by putting the power of data visualizations in the hands of the public – giving them important yet easily understood insight of the political scenario.
Vijay Karnataka, a Daily Kannada newspaper (part of TOI group), recently published articles over a period of 6 weeks, containing Gramener’s visualizations that offer its readers a never-before-experienced level of insight into important aspects of the State’s political environment, individual politicians, and the democratic environment itself.
Effectively the visualizations helped people in consumption of data about attributes like – wealth possessed by MLA’s, their attendance to the assembly, performance, accessibility and trustworthiness.
Mr. SugataSrinivasaraju – Editor Vijay Karnataka (Karnataka’s No.1 Daily), says: “Facts and figures are sacred for a newspaper. They form the credible core of any publication. However, readers would consume them only when they are presented in an interesting and consumable fashion. This election season, the experiment of visualising poll data that Vijay Karnataka carried out in association with Gramener has been a very fruitful and rewarding exercise. We were able to generate tremendous reader interest and reaction to the many ‘cartograms’, ‘scatter plots’ and ‘sun bursts’ that we published over six weeks. This was possible because the visualisations were accessible, engaging and offered a unique insight into the elections. Besides, they also provided a futuristic dimension to the big game of democracy.”
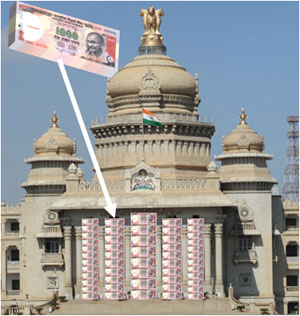
The visualization below depicts – the amount of wealth possessed by a candidate, when converted to money could block the main gate of the Karnataka Assembly.
http://www.vijaykarnatakaepaper.com/epaperpdf/2632013/2632013-md-hr-9.pdf
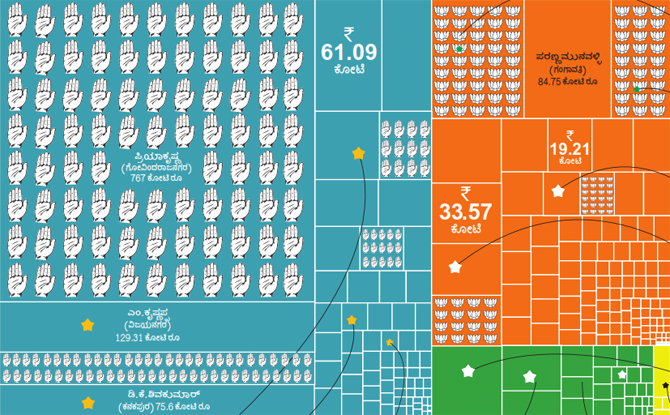
Tree map of amount of assets across parties.
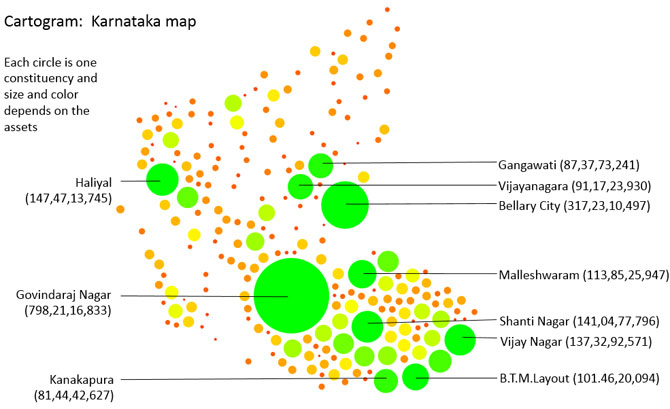
Below Karnataka map represents total assets of candidates in each constituency.
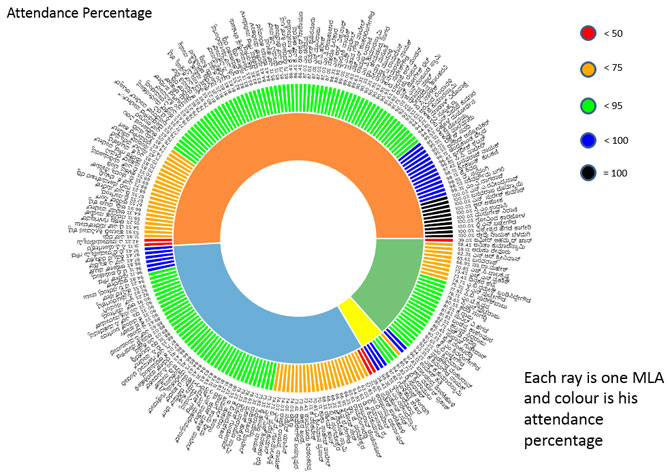
Musical Sunburst of Attendance percentage of MLA’s
http://www.vijaykarnatakaepaper.com/epaperpdf/942013/942013-md-hr-11.pdf
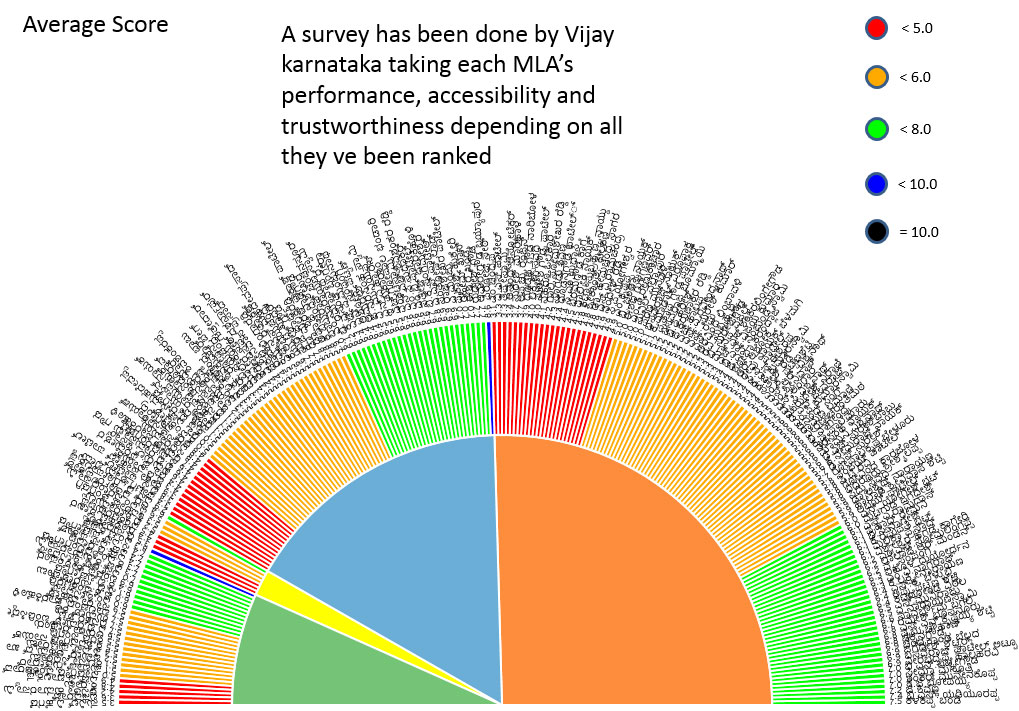
Musical sunburst representing Average score of each MLA for peformance,accessibility and trustworthiness based on survey.
Industry 4.0 solutions originally had their genesis in manufacturing. “The Fourth Industrial Revolution, Industry 4.0,… Read More
Improvement in production performance can enhance supply chain efficacy. There is a continuous discourse around… Read More
Sshhhhhh, ChatGPT knows everything!! In 2023, Generative AI (GenAI) emerged as a major technology disruption… Read More
Generative AI holds immense promise for healthcare, leveraging large datasets to innovate medical imaging, treatment… Read More
NJBIZ has recognized Naveen Gattu, Founder and Chief Operating Officer of Gramener—A Straive Company, as… Read More
This website uses cookies.
Leave a Comment