This is a guest post by Nirav Chadda
Amidst the FIFA world cup fever, a few visual designers got together to celebrate it in a different way and met at Gramener. We explored the past, studied the trends and predicted the future. Each did it in their own amazing styles.
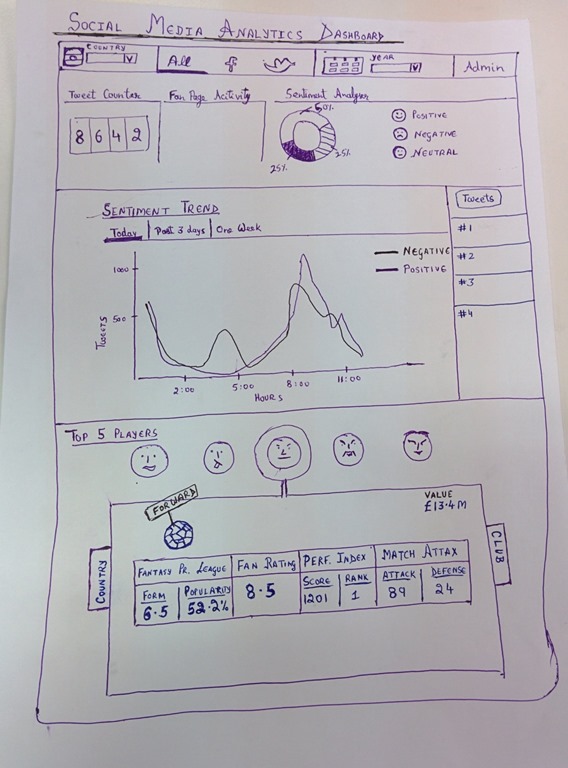
I tried to visualize a layout which had two views namely:
Social Media Analytics Dashboard: In here, I have tried my best to analyse all the available social media data and show it to the user in as simple a form as possible.
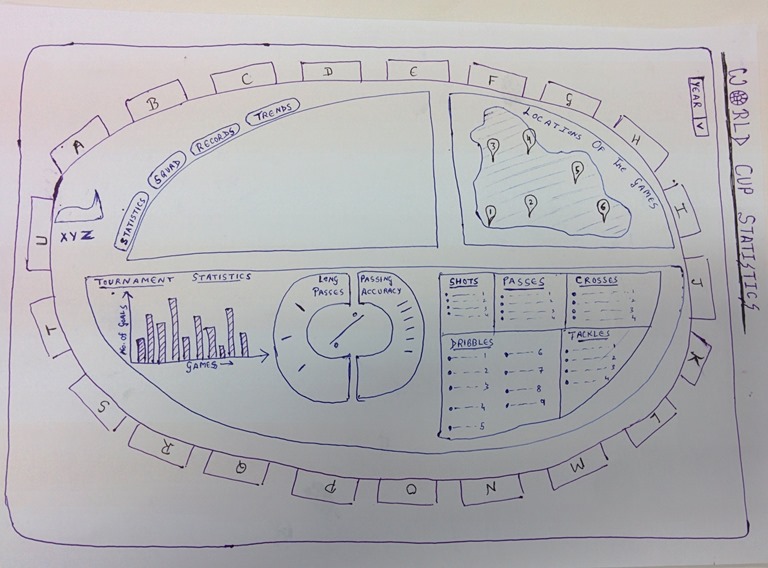
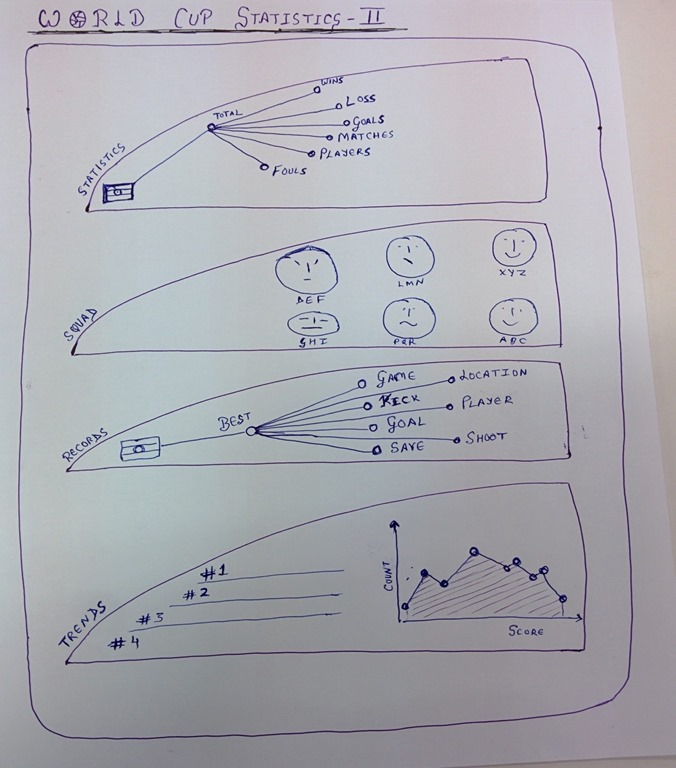
World Cup Statistics Dashboard: Here I aim to just use one filter, i.e. year, and show all the past statistics for every country in shape of a football field.
The aim of both these dashboards is to look at the trends or stats at a place and at a go,in a very user friendly way.
The emergence of Generative AI (GenAI) is reshaping healthcare use cases and facilitating the rapid… Read More
The U.S. Food and Drug Administration's (FDA) stance on GenAI is clear: it's a groundbreaking… Read More
Executive Summary In healthcare, protecting patient information is not just a legal requirement; it's a… Read More
Demand forecasting in the supply chain is crucial for optimizing inventory levels and ensuring efficient… Read More
Hi, I am ChatGPT 3.5 Turbo. Do you know what my favorite number is? Do… Read More
After a successful webinar on digital transformation and sustainability, we organized a sequel titled “Data-Driven… Read More
This website uses cookies.
Leave a Comment