When the Election Commission results for the 2011 assembly elections came out, we thought we’d take a look at the results for Tamil Nadu.
The easiest way to see geographic data is, of course, on a map. Since the results are announced constituency-wise, it makes logical sense to plot each constituency on the map.
However, map-based visualisations suffer from one problem: the area of a geographic region is not always proportional to its importance. In elections, each constituency equal weightage: one seat. But the areas can vary considerably. Chennai, for instance, is a tiny dot on the map, but yet is split into three different constituencies.
A better way is to take an approximation of the map. We can plot each constituency as a block, and position it roughly at its geographic location, and roughly preserve adjacency. This gives a reasonably good geographic picture, while showing relative importance accurately.
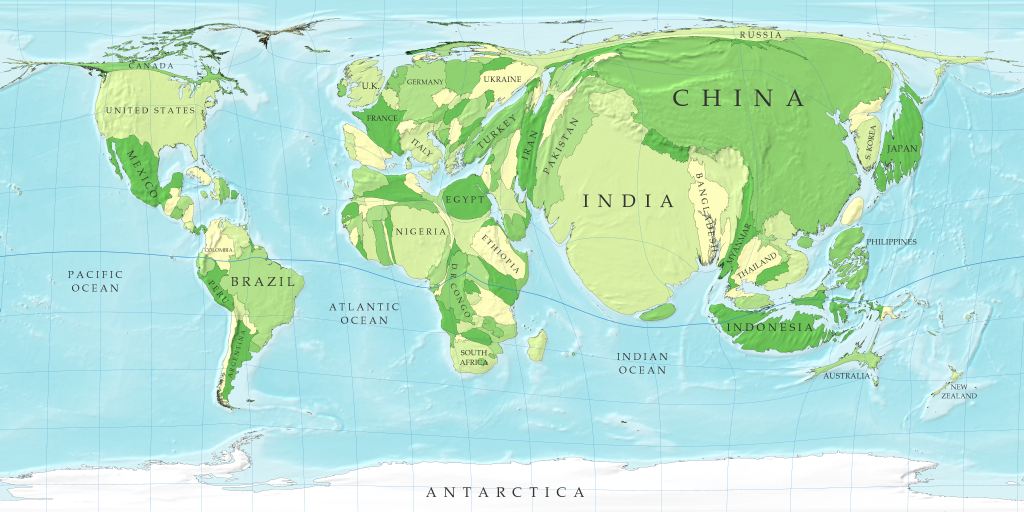
For example, here is a world map: the area is proportional to each country’s population.
We did the same for Tamil Nadu. Below is an interactive map that shows voter turnout. Hovering over each cell will show the number of voters that turned out in that constituency. Black shows higher votes, white shows fewer voters.
The number of the registered voters ranges from 140,000 (Kilvelur) to 360,000 (Shozhinganallur). Each box represents one constituency, with a position approximating its geographic location. This is a reasonably good proxy for a constituency density map.
Now, let’s take a look at voter turnout.
The voter turnout was pretty high, at 78%. Not too different between the men (77.7%) and women (78.5%), but quite different across constituencies. Palacodu, Kulithalai and Veerapandi led the pack with turnouts of 87%, 89% and 89% while Chennai Harbour, Killiyoor and Colachal bottom at 64% each. The lowest turnouts are concentrated around Chennai, Coimbatore and Kanyakumari – interestingly these are the more affluent areas.
Clearly, ADMK has swept the elections. What’s interesting is that they won absolute majorities in a number of areas (highlighted by the darker shades of green), unlike DMK or MDMK, who mostly won simple majorities.
A number of ADMK victories were by a large margin, but so were some of the DMDK and DMK victories. AKT Raja of DMDK won Thirupurankundram with a 30% margin, for example. Former Chief Minister M. Karunanidhi (DMK) won with a comfortable 29% margin at Thiruvarur as well. Vijaykant (DMDK) managed an 18% margin at Rishivandiyam. It is interesting that 92% women voted at Rishivandiyam – significantly higher than anywhere else in the state.
The emergence of Generative AI (GenAI) is reshaping healthcare use cases and facilitating the rapid… Read More
The U.S. Food and Drug Administration's (FDA) stance on GenAI is clear: it's a groundbreaking… Read More
Executive Summary In healthcare, protecting patient information is not just a legal requirement; it's a… Read More
Demand forecasting in the supply chain is crucial for optimizing inventory levels and ensuring efficient… Read More
Hi, I am ChatGPT 3.5 Turbo. Do you know what my favorite number is? Do… Read More
After a successful webinar on digital transformation and sustainability, we organized a sequel titled “Data-Driven… Read More
This website uses cookies.
View Comments
Excellent blog! One question regarding these maps: is it possible to create a map for the 403 assembly constituencies in UP? Thank you.
Expecting the similar analysis after the Karnataka Polls ( 2013 )