Forensic science applies scientific principles to evidence to discover past fraud. Let’s extend that to data, and initiate a journey into data forensics. We’ll begin with school marks.
One powerful tool at the hand of a forensic data scientist is the humble histogram: plotting frequency distributions of values. For example, birthdays are not random and some birthdays are systematically avoided (e.g. April Fool’s day, the 13th of any month.)
It is powerful for the same reason that fingerprints are effective: they are easy to leave behind, difficult to erase, and highlight who did what and where.
Let’s apply this to the marks scored in English by the CBSE class 12 students in 2013. English is the single most common subject taken by students – over 8.5 lakh students wrote the English exams out of the 9.4 lakh students.
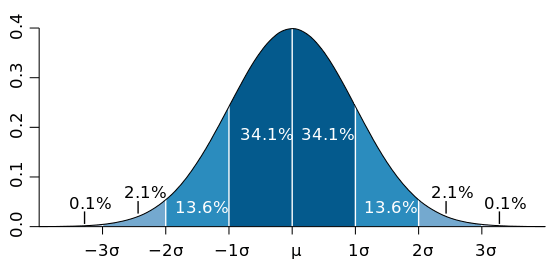
Typically, such mark distributions are normal distributions – smooth, thin near the ends and thick at the center. This is mainly because most exams require a combination of abilities (spelling, grammar, comprehension, creativity, etc.). Few people excel in all of these. Few suffer from the complete lack of all of these. Hence we expect to see fewer people at the edges than at the center.
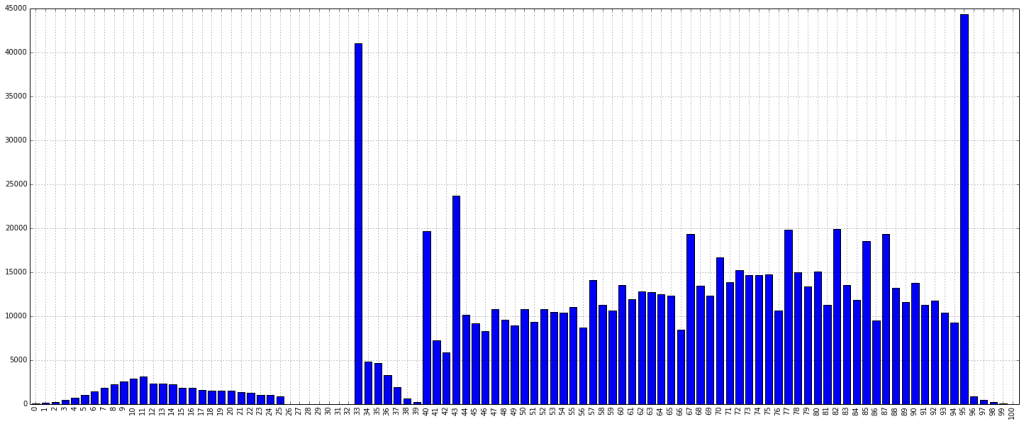
What we observe, in fact, is the following distribution. The height of each bar represents the number of students who got a specific mark between 0 – 100.
Several items are noteworthy. Let’s begin with the two large spikes.
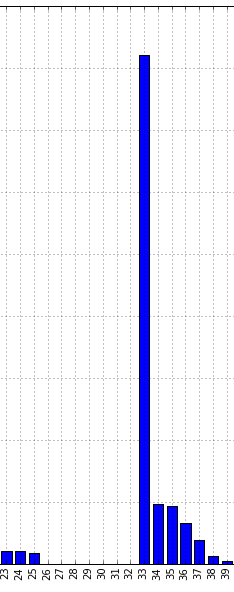
The spike on the left appears at 33 marks. Further, no student has marks between 26 – 32.
The qualifying marks in each subject of external examination shall be 33% at Secondary / Senior School Certificate Examinations. However at Senior School Certificate Examination in a subject involving practical work, a candidate must obtain 33% marks in the theory and 33% marks in the practical separately in addition to 33% marks in aggregate, in order to qualify in that subject.
That gives us a plausible explanation: the kind souls correcting these papers give borderline students the benefit of doubt, and ensure that no one has “just failed”. Either students fail to reach 25%, or they are unofficially bumped up to 33%. This is popularly termed moderation. However, it is not documented in any guidebook that we know of.
Unlike 33%, the 95% score might be more driven less by the structure of exams and more by media. In May 2013, several media organisations announced the steadily rising number of students scoring 95% and more, and the fact that this trend has continued across many years.
Our best guess is that this shows a pattern of reverse moderation. To reduce the number of students scoring above 95%, the marks of several such students was brought down to 95%, leading to the large spike.
Clearly, for the students that are naturally good at English, 2013 was not a good year to have taken the CBSE exam – especially given that most colleges have cut-offs at above 95%.
We will be periodically re-visiting education data (marks, infrastructure, spending, etc.) to see what else we can learn – both about the Indian education system as well as data forensics.
The emergence of Generative AI (GenAI) is reshaping healthcare use cases and facilitating the rapid… Read More
The U.S. Food and Drug Administration's (FDA) stance on GenAI is clear: it's a groundbreaking… Read More
Executive Summary In healthcare, protecting patient information is not just a legal requirement; it's a… Read More
Demand forecasting in the supply chain is crucial for optimizing inventory levels and ensuring efficient… Read More
Hi, I am ChatGPT 3.5 Turbo. Do you know what my favorite number is? Do… Read More
After a successful webinar on digital transformation and sustainability, we organized a sequel titled “Data-Driven… Read More
This website uses cookies.
View Comments
Thanks for making drab data interesting, fun & insightful.
Keep up the good work!
you have made graphs and figures to look simple and understandable!